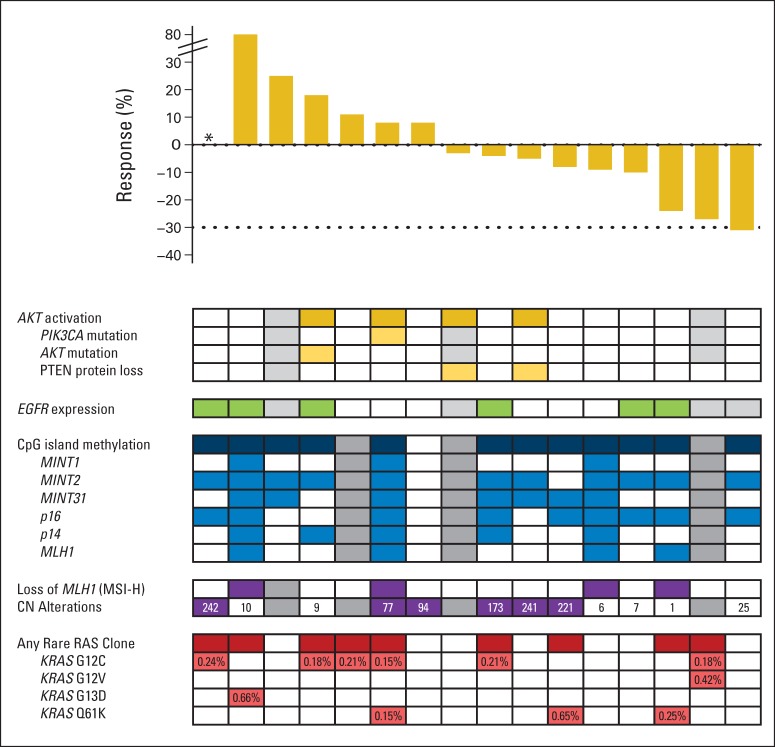
Fig 2.
Correlation of best overall response rate with molecular characterization. Gray boxes represent samples unable to be analyzed for the specified assay. Numbers in the copy number (CN) alteration boxes represent the number of unique segments with CN alterations. Percentages in the RAS clone box represent mutant allele frequency. (*) Not evaluable for response.

