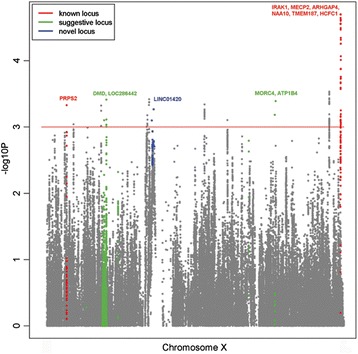
Fig. 1.

Manhattan plot of the X chromosome association analysis on SLE. Manhattan plot of association results (−log10(P value)) are depicted with regards to the physical location of SNPs and include both imputed and genotyped association results. Positions and genes were based on National Center for Biotechnology Information build 37 (http://www.ncbi.nlm.nih.gov/assembly/GCF_000001405.25/). The color of gene labeling corresponds to the gene type of known loci, suggestive loci, and novel loci. Known loci are defined as loci published previously, whereby novel loci are defined as loci in the current study validated at genome-wide significance (P <5 × 10⁻⁸)
