
Fig. 3.
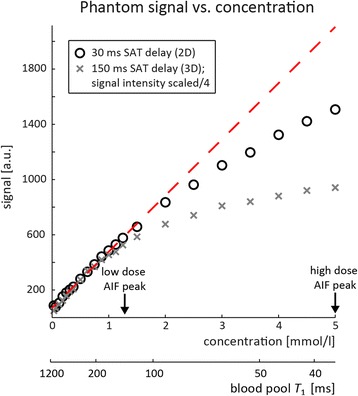
Measured phantom signal intensity vs. contrast agent concentration. Signal intensity vs. phantom CA concentration was measured for 2D and 3D saturation (SAT) delays used in-vivo. Corresponding T 1 values calculated using equation (1) and baseline T 1 = 1200 ms are shown alongside. Approximate peak concentrations at low and high dose are indicated by arrows. For low enough CA concentration, the linearity to the signal intensity is approximately valid (dashed red line). Non-linearity starts at concentrations of 1 and 2 mmol/l for saturation delays of 150 and 30 ms, respectively