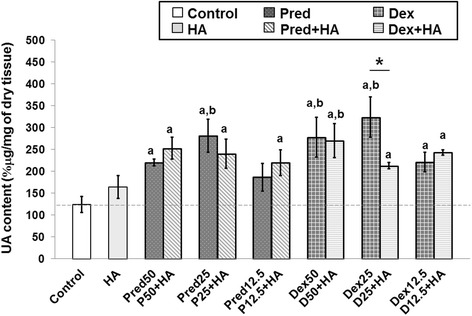
Fig. 3.

The percentage of uronic acid (UA) content patterns of steroids in combination with the HA treatment. The UA content of the cartilage explant treatments was calculated and shown in % μg/mg of dry tissue. The white bar denotes the control group; the light gray bars denote the HA-treated or the co-treated groups; and the dark gray bars denote the steroid-treated groups. Error bar: standard deviation of each group (n = 3 for each group). Significant differences are considered to exist when p < 0.05:“a” stands for significant differences compared with the control group; “b” denotes significant differences compared with the HA group; and asterisk (*) denotes significant differences between the treatment groups
