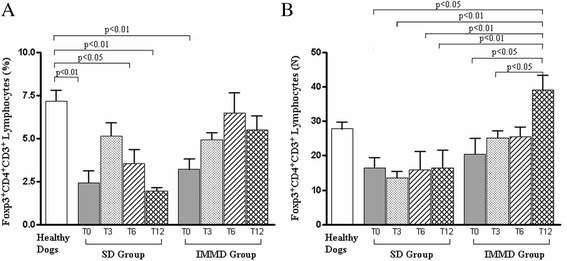
Fig. 3.

The combination of the pharmacological treatment with an immune-modulating diet restores Treg percentage and count in sick dogs. Panel A and B show the percentage and count (x10−6/L), respectively, of Foxp3 + CD4 + CD3+ (Treg) cells in healthy dogs, in sick dogs at T0, T3, T6 and T12 in SD Group (pharmacological treatment alone) and IMMD Group (pharmacological treatment and immune-modulating diet), as indicated. The column of Healthy Dogs refers to the means ± SD values of normal range (see material and methods) of Treg measurements in healthy controls. Results were considered significant at p < 0.05
