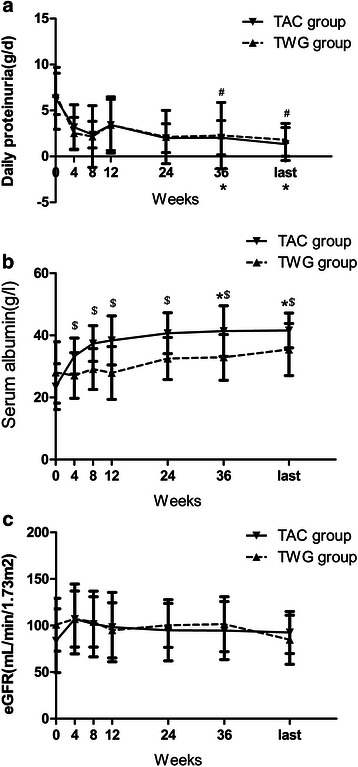
Fig 3.

Time course of daily urinary protein levels, serum albumin levels, and eGFR levels in patients who received either TWG or TAC therapy. #statistically a significant difference between the start and end of treatment in the TWG group (p < 0.05); *statistically a significant difference between the start and end of treatment in the TAC group (p < 0.05); $statistically a significant difference between the 2 groups (p < 0.05). (a) Daily proteinuria of patients in the two group. (b) Serum albumin of patients in the two group. (c) eGFR of patients in the two group
