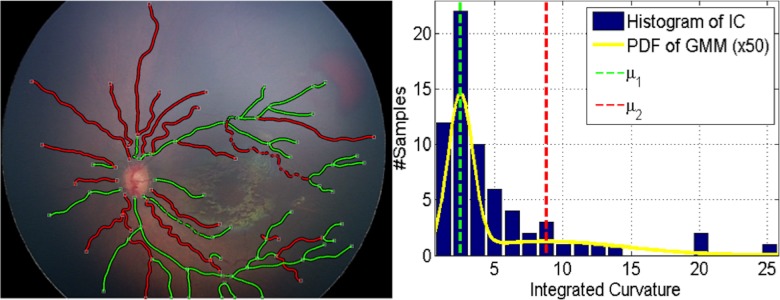
Figure 4.
Clustering of vessel segments based on the GMM on integrated curvature (IC) feature for an example image. In the left, white squares indicate the junction/end points of vessels. Each segment is shown with its corresponding cluster color. Right figure displays the histogram of the IC feature for that image, along with the GMM. The yellow line indicates the probability density function (PDF) of all the segments. The mean of each mixture component is shown with dashed lines with its respective color.

