
Fig. 4.
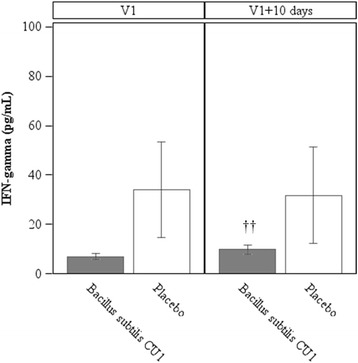
Concentrations of IFN-gamma in blood. IFN-gamma concentrations were assessed in subjects from the subset of population (N = 44), at baseline (V1), after 10 days of consumption of study products (V1+ 10 d) and at the end of the study (V3). Values are means, with standard error of means represented by vertical bars. IFN-gamma concentrations were significantly increased in the probiotic group between V1 and V1 + 10 d (††P <0.01)