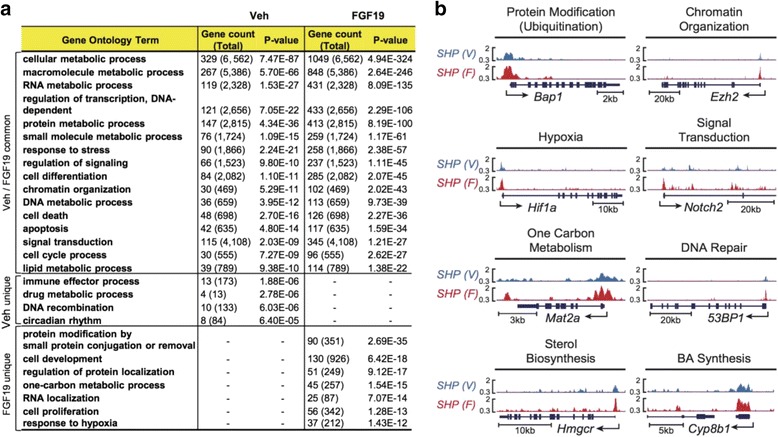
Fig. 3.

GO analysis and display of SHP binding peaks. a Categories (from the top 500 GO annotations) of the potential SHP target genes (nearest to and within 50 Kb of SHP binding peaks using GREAT) detected for both groups and uniquely in each group. b Normalized SHP binding peaks at hepatic genes involved in diverse biological pathways are displayed (UCSC genome browser)
