
Fig. 12.
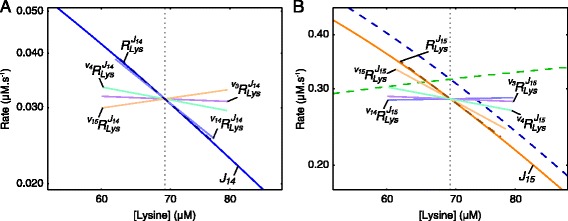
Rate characteristic plots of the supply blocks of lysine in the aspartate metabolism model. Partial and total response coefficients are indicated as lines intersecting the a J 14-curve and b J 15-curve at the steady-state value of Lys (see Table 2). Partial response coefficients (solid lines) indicate the relative contribution of each respective route of interaction of Lys with reaction blocks 14 and 15 towards the total responses (dashed lines) at the steady-state. The unlabelled dashed curves represent the total supply (blue) and total demand (green). The steady-state value of Lys is indicated as a vertical dotted line in both (a) and (b)