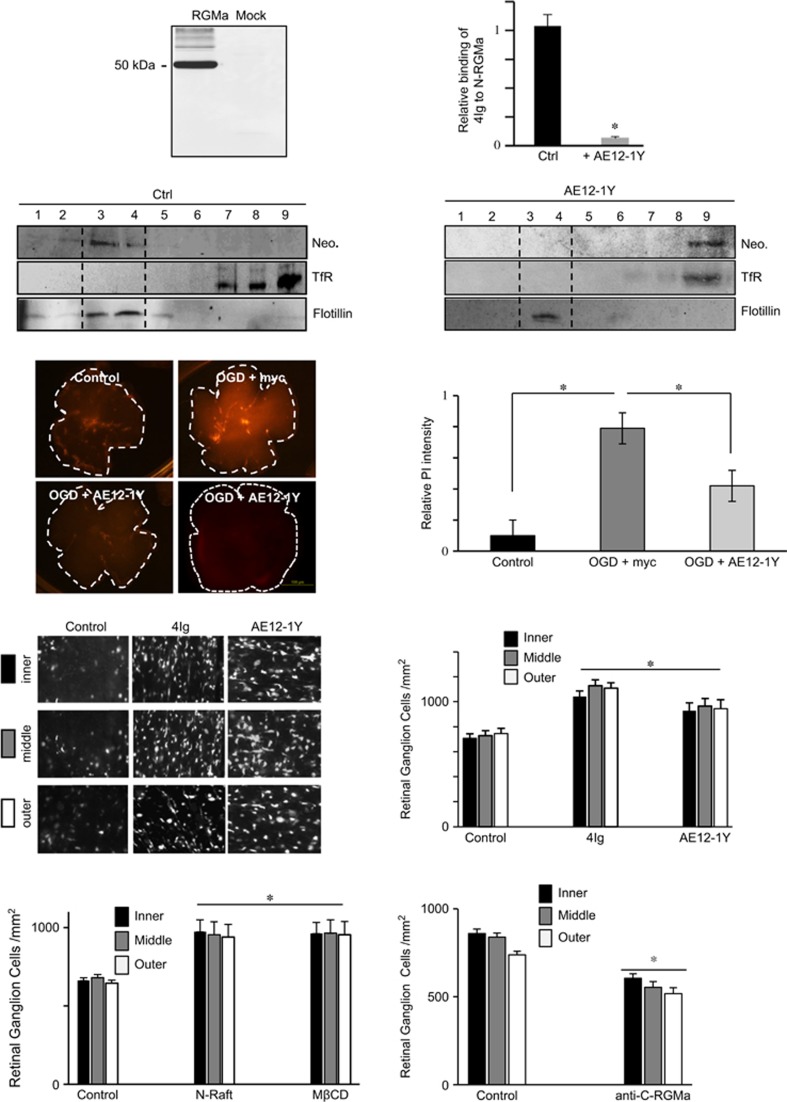
Figure 2.
Mab AE12-1Y prevents Neogenin association with lipid rafts and promotes survival in the ischemic eye. (a) Western blot performed with AE12-1Y on RGMa or mock-transfected cells revealed that this antibody specifically recognized RGMa. (b) The interaction between the 4Ig domain of Neogenin and the N-Raft was assessed in an ELISA assay. AE12-1Y blocked the N-RGMa/Neogenin interaction, whereas a human IgG (control) did not. (c and d) Antibodies were injected into the E8 chick brain and 24 h after brains were collected and membrane fractionations prepared and analyzed in western blots. In controls, Neogenin localized with a marker for lipid rafts (Flotillin). Injection of mab AE12-1Y altered Neogenin localization, which colocalized with a marker for the heavy membrane fraction (transferin receptor, TfR). (e and f). Retinal whole mounts were submitted to OGD (1 h). One day after OGD, whole mounts were stained with PI to assess cellular death. (e) Representative micrographs 24 h following OGD. (f) Quantifications of experiments presented in e show that mab AE12-1Y significantly improved survival. (g and h) Panels taken at 14 days after ligation of the optic artery, show RGCs that were retrogradely labeled with Fluorogold. Control retinas, injected with human IgG at 3 and 10 days after ischemia had very few RGCs remaining at 14 days after axotomy; whereas, 4Ig and AE12-1Y injected retinas had many surviving RGCs. (h) Quantifications show that 4Ig and AE12-1Y significantly increased RGC survival following optic artery ligation. (i) Quantifications of experiments in which animals were treated with N-raft and MβCD following optic artery ligation show that these treatments significantly increased RGC survival compared with control peptide. (j) Quantifications of experiments in which anti-C-RGMa antibody was injected following optic artery ligation show that this peptide significantly promoted RGC death compared with control antibody. Values shown are mean±S.E.M. for six control retinas and eight 4Ig and eight AE12-1Y retinas in each experimental group. Significant differences were determined by ANOVA, followed by Tukey's test (*P<0.001)

