Figure 2.
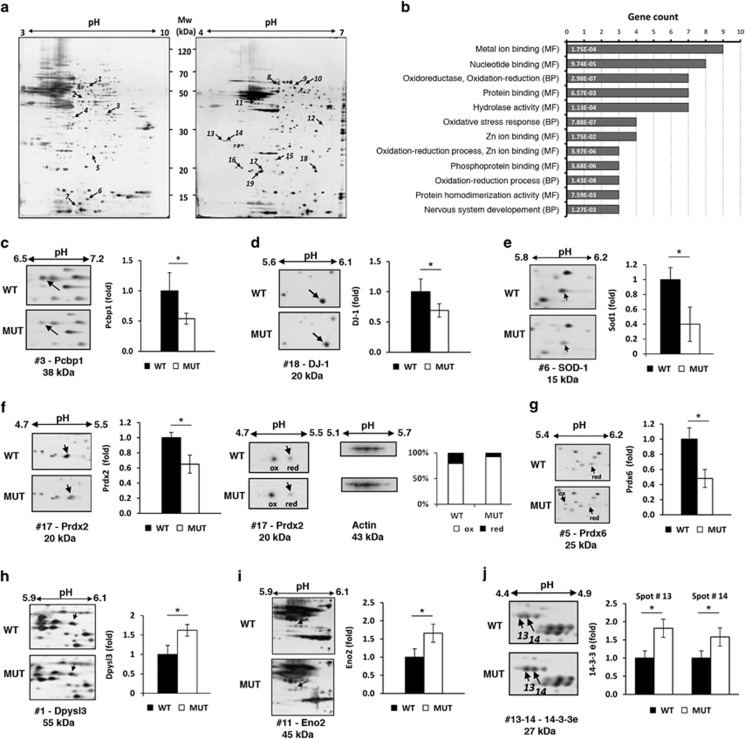
Changes in expression levels of selected proteins identified by proteomic analysis. (a) Representative proteomic maps of mutant mice cerebella. Mixture of cerebellar proteins were separated by 2-DE using two immobilized pH gradients, pH 3–10 (left) and pH 4–7 (right), 13-cm in length. Protein patterns were visualized by ammoniacal silver staining. Vertical and horizontal axes indicate apparent molecular mass and pI values, respectively. Differentially represented protein spots in the mutant mice are highlighted; numbering in Figure corresponds to numbering in Tables 1 and 2. These spots were subjected to nLC-ESI-LIT-MS/MS analysis for protein identification. (b) Functional clustering of the identified proteins. Functional enrichment analysis of the protein species identified by proteomic analysis according to molecular function (MF) and biological process (BP) is shown. GeneCodis analysis of the differentially represented proteins was performed. For simplicity, only the most representative functional categories are represented. The number of genes for each category is provided on horizontal axis and list only the first 13 co-occurrence terms. Statistical significance belonging to each category is shown within each bar. See Supplementary Table S2 in Supplementary Material for the full list of annotations. (c–j) Representative gel regions of 2-DE gels stained by ammoniacal silver were cropped. Protein variation in Ugt1 mutant mice (MUT) with respect to control (WT) are reported in the histograms. Histograms represent the normalized volume values of each spot of interests as obtained from four independent replicas. Data are the mean±S.D. of four independent experiments. Black boxes represent protein-normalized expression in the control (WT) mice cerebella, whereas white boxes represent the counterpart in the mutant mice cerebella. For Prdx2 (panel f), the histogram corresponding to the western blot analysis represents the relative amount of each forms (reduced or oxidized) expressed as percentage of the total amount of protein. Statistical significance is indicated by an asterisk, P<0.05

