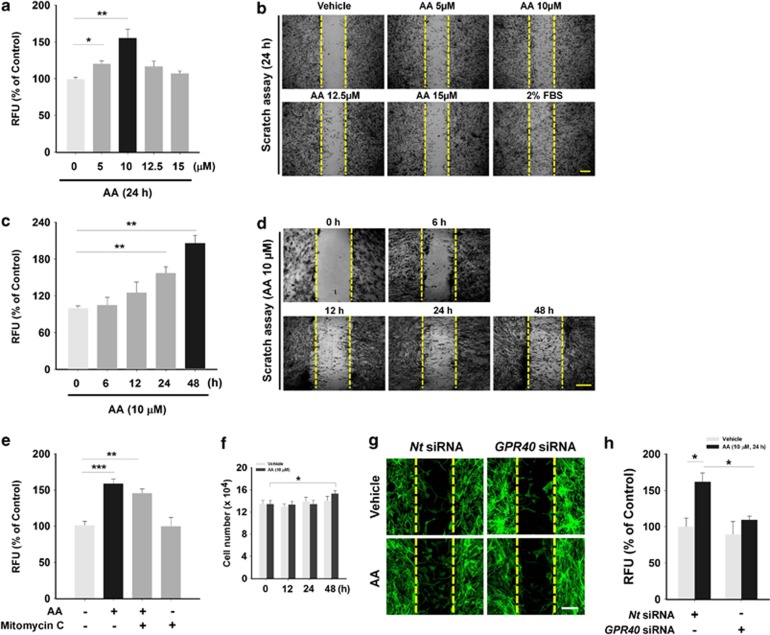
Figure 2.
Effect of AA on hUCB-MSCs migration. (a and c) Dose and time responses of hUCB-MSCs treated with AA in Oris cell migration assay are shown. Cells were incubated with different doses of AA (5–15 μM) for 24 h and with 10 μM of AA for different time periods (0–48 h), respectively. (b and d) The dose and time responses to AA are also shown in scratch assay. Cells were treated with AA in the same manner as used in Figures 2a and c. Two percent fetal bovine serum was added for positive control. (e) The effect of Mitomycin C on AA-induced cell migration was evaluated with Oris cell migration assay. Cells were pretreated with the Mitomycin C (1 μg/ml) for 30 min and then stimulated with 10 μM of AA for 24 h. (f) Cells were incubated with 10 μM of AA for 0–48 h and analyzed for their proliferation by cell counting. (g and h) Cells transfected with GPR40 specific siRNA (100 nM) were incubated with 10 μM of AA for 24 h and the motility was assessed by (g) wound healing assay and (h) Oris cell migration assay. (a–d) n=3. (e) n=4. (f) n=6. (g and h) n=3. Data represent means±S.E. *P<0.05, **P<0.01, ***P<0.001. Scale bars=100 μm (magnification × 100). Abbreviations: RFU, relative fluorescence units

