Figure 6.
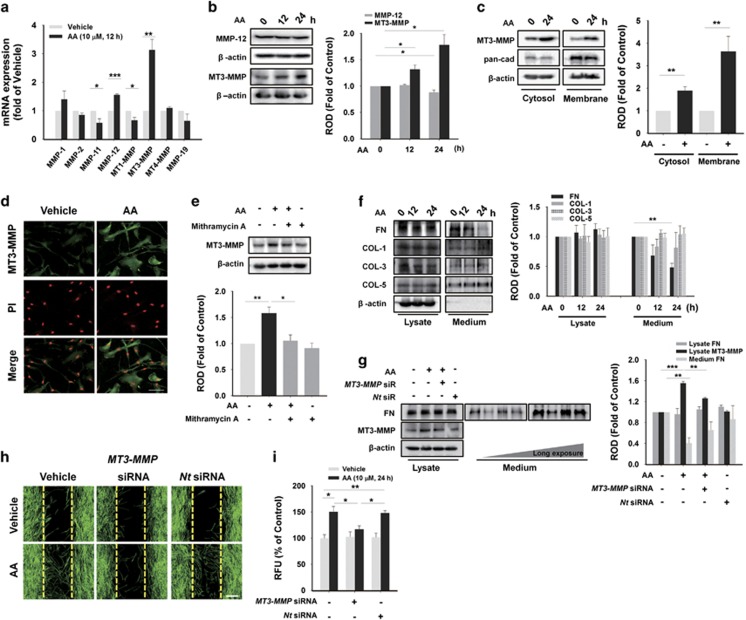
AA stimulates MT3-MMP expression, which degrade FN. (a) With real-time PCR, the mRNA expression of MMP family was analyzed in hUCB-MSCs treated with 10 μM of AA for 12 h. (b) Cells were exposed to 10 μM of AA for different time periods (0–24 h), and total cell lysates were subjected to SDS-PAGE for detecting MMP-12 and MT3-MMP. (c) Cells were incubated with 10 μM of AA for 24 h and fractionated into cytosolic and membrane samples. Translocation of MT3-MMP was detected by western blotting, and pan-cadherin was used as a control for plasma membrane. (d) Cells treated with 10 μM of AA for 24 h were immunostained with MT3-MMP antibody (green). PI was used for nuclear counterstaining (red). Scale bars=100 μm (magnification × 400). (e) Cells were pre-treated with 5 μM of Mithramycin for 30 min prior to 10 μM of AA exposure for 24 h. Then, total proteins were extracted and examined with MT3-MMP antibody by western blotting. (f) Cells were treated with 10 μM of AA for 24 h. Western blot assay of FN, COL-1, COL-3, and COL-5 on both cell lysates and proteins precipitated from medium by 30% trichloroethanoic acid was carried out. (g) Cells were transfected with MT3-MMP siRNA (25 nM) for 24 h prior to 10 μM of AA incubation for 24 h. And protein levels of FN both in cell lysates and in medium were analyzed with western blotting. In (h) wound healing assay and (i) Oris cell migration assay, MT3-MMP specific siRNA (25 nM) were transfected to cells for 24 h prior to 10 μM of AA treatment for 24 h. And then, we examined the inhibitory effect of knockdown of MT3-MMP on the cell migration. Scale bars=100 μm (magnification × 100). (a–c and e–g) n=3. (d) n=5. (h and i) n=4. Data represent means±S.E. *P<0.05, **P<0.01, ***P<0.001. Abbreviations: RFU, relative fluorescence units; ROD, relative optical density

