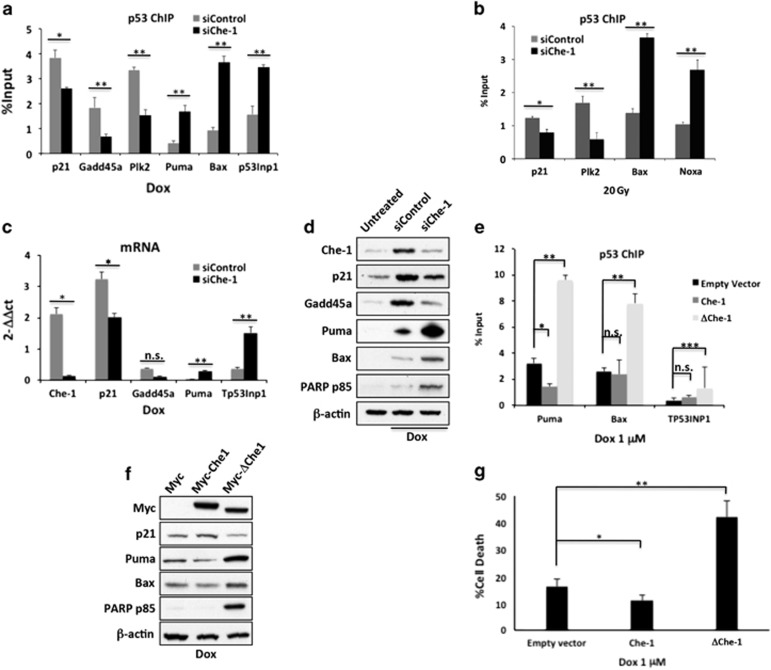
Figure 6.
Che-1 promotes transcriptional activation of genes involved in growth arrest and inhibits p53 apoptotic activity. (a and b) Nuclear extracts from HCT116 cells transiently transfected with siRNA GFP (siControl) or siRNA Che-1 (siChe-1) and treated with 1 μM Dox (a) or 20 Gy IR (b) were subjected to quantitative ChIP analysis (ChIP-qPCR) using anti-p53 antibody or control rabbit IgGs. Data are expressed as percent of input. Error bars represent the standard error of three different experiments. (a) *P=0.004, **P<0.0001; (b) *P=0.003; **P<0.0001. (c) Quantitative RT-PCR (qRT-PCR) for the indicated genes was performed after transient transfection of HCT116 cells with siRNA GFP (siControl) or siRNA Che-1 (siChe-1) and 1 μM Dox treatment. Values were normalized to RPL19 expression. Error bars represent the standard error of three different experiments. *P≤0.0008, **P≤0.03, n.s., not significant. (d) WB with the indicated abs of TCEs from HCT116 cells transfected with siRNA GFP (siControl) or siRNA Che-1 (siChe-1) and treated or not with 1 μM Dox. (e) ChIP-qPCR analysis of nuclear extracts from HCT116 cells transiently transfected with empty vector, Myc-Che-1 WT or Myc-ΔChe-1 expression vectors and treated with 1 μM Dox. Data are expressed as percent of input. Error bars represent the standard error of three different experiments. *P=0.0015, **P<0.0001, ***P=0.0009, n.s., not significant. (f) WB with the indicated abs of TCEs from HCT116 cells transfected and treated as shown in (e and g). HCT116 cells were transfected and treated as shown in (e). Cell death was assayed by trypan blue staining and percentages represent trypan blue incorporating cells. Columns are average of three independent experiments and error bars indicate standard deviation. *P=0.01, **P<0.0001

