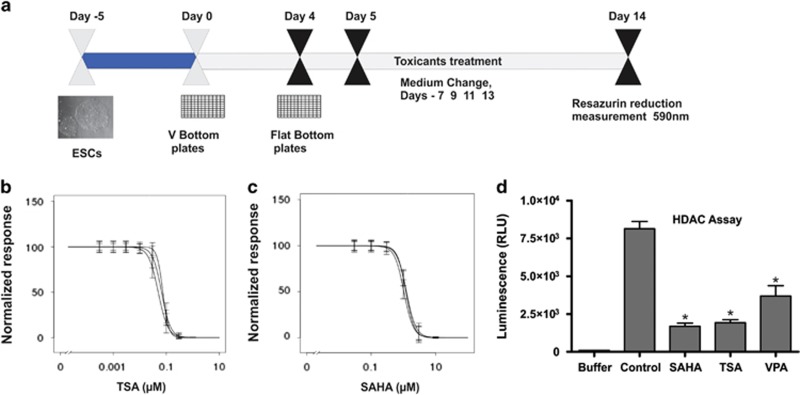
Figure 1.
Determination of sublethal concentration and HDAC inhibition. (a) To determine the dose-response curve for TSA and SAHA, hESCs were exposed to various concentrations of the compounds from days 5 to 14. Resazurin reduction was used as a parameter to detect cytotoxicity. Cell viability was calculated after normalizing the fluorescence intensity values to the control. Three independent biological replicates were performed, and at least five technical replicates were performed for each biological replicate. The inhibitory concentration (IC) values were calculated from the graph. (a) A representative scheme for sublethal concentration determination. (b and c) Cytotoxicity curve of TSA and SAHA based on the resazurin reduction assay. (d) Enzymatic activity of VPA, SAHA and TSA compared with control. Data represent mean values of three measurements±S.E.M (*P<0.05, SAHA, TSA and VPA versus control). RLU, relative luminescence units

