Figure 5.
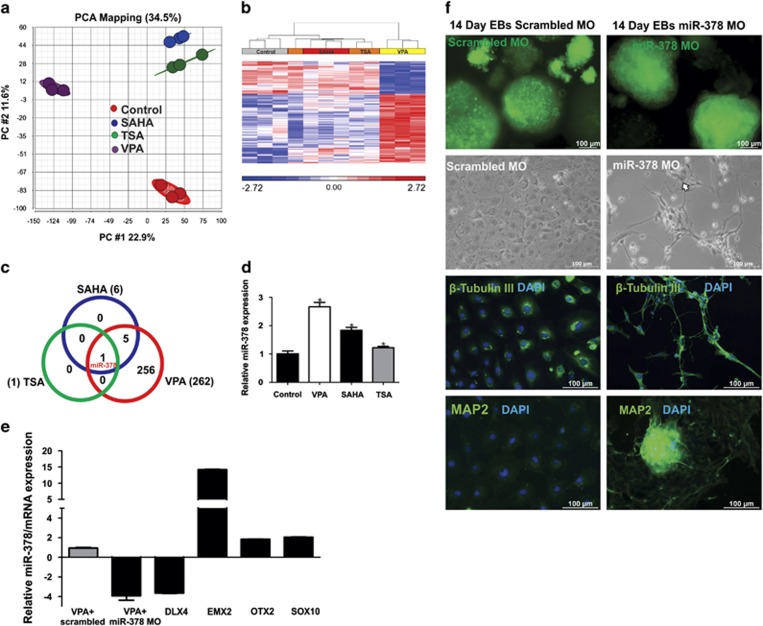
HDAC inhibitors commonly dysregulated miR-378 and VPA represses dorsal forebrain markers via mir-378. (a) PCA of normalized miRNAs demonstrates total 34.5% variance. (b) Hierarchical cluster analysis of differentially expressed miRNAs (FDR P<0.05, ±1.5-fold change) after HDAC inhibitors treatment. Red color showed upregulated and blue color showed downregulated miRNAs. VPA shared a higher percentage of variances compared with TSA and SAHA. (c) The Venn analysis showed that miR-378 is commonly dysregulated within the HDACi. (d) RT-qPCR analysis of miR-378 for HDACi is consistent with the microarray results. The validation has been performed with the same array samples from three biological replicates. The error bar represents S.D. (e) In all, 75% of miR-378 knockdown enhances the dorsal forebrain markers and represses the ventral forebrain markers. Error bar represents S.E.M. from two biological replicates (values were set as relative fold changes of the mRNA levels as compared with the VPA control). (f) Fluorescence microscopy (excitation: 488 nm, emission: 509 nm) demonstrating cellular uptake of the scrambled and the MOmiR-378. Morphological representation at day 14 shows miR-378 knockdown exhibits appearance of neuronal projections and expression of mature neuronal-specific markers even after 2 mM VPA treatment

