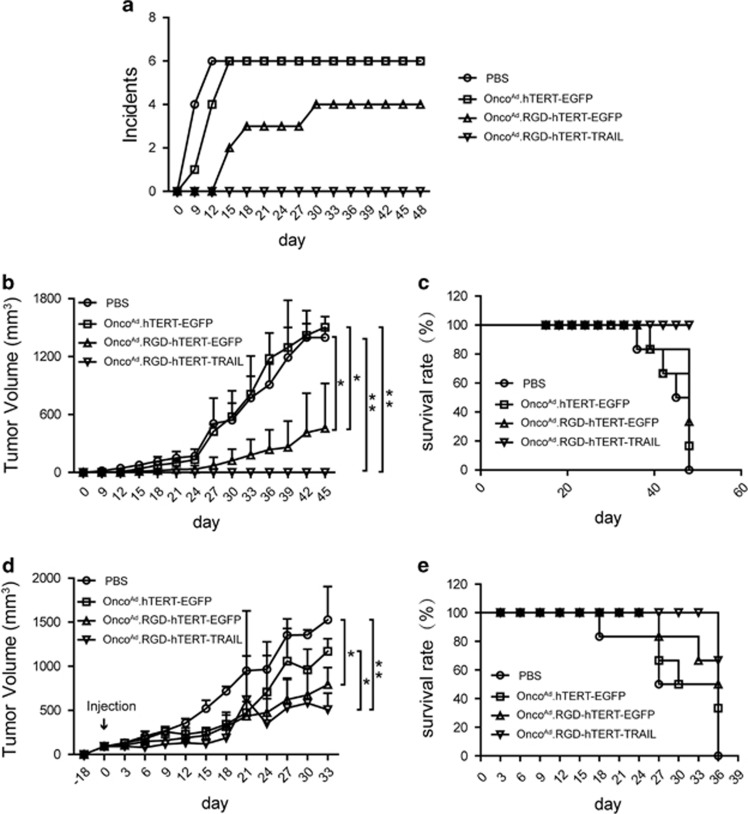
Figure 4.
OncoAd.RGD-hTERT-TRAIL suppressed tumor initiation and growth in vivo. (a) Comparison of tumor-initiating ability on T24 sphere cells pre-treated with PBS, OncoAd.hTERT-EGFP, OncoAd.RGD-hTERT-EGFP and OncoAd.RGD-hTERT-TRAIL for 4 h. The number of tumor occurrence was plotted against time after inoculation (day 0). Incidence indicated the number of mice with palpable tumor. (b) Growth curve of subcutaneous tumors with the indicated pre-treatment. (c) Survival status of mice with the indicated pre-treatment. (d) Growth curve of subcutaneous tumors with the indicated intra-tumor adenovirus injection. Oncolytic adenoviruses were intratumorally injected (day 0) after subcutaneous tumor inoculated for 18 days, with corresponding volume of PBS control. Arrow represented the action of intratumoral injection. (e) Survival status of mice with the indicated intratumoral treatment. Tumor volume was measured every 3 days and the data shown represented mean±S.D. (n=6). The number of mice for each kind of treatment was six. *P <0.05, **P<0.01

