Figure 2.
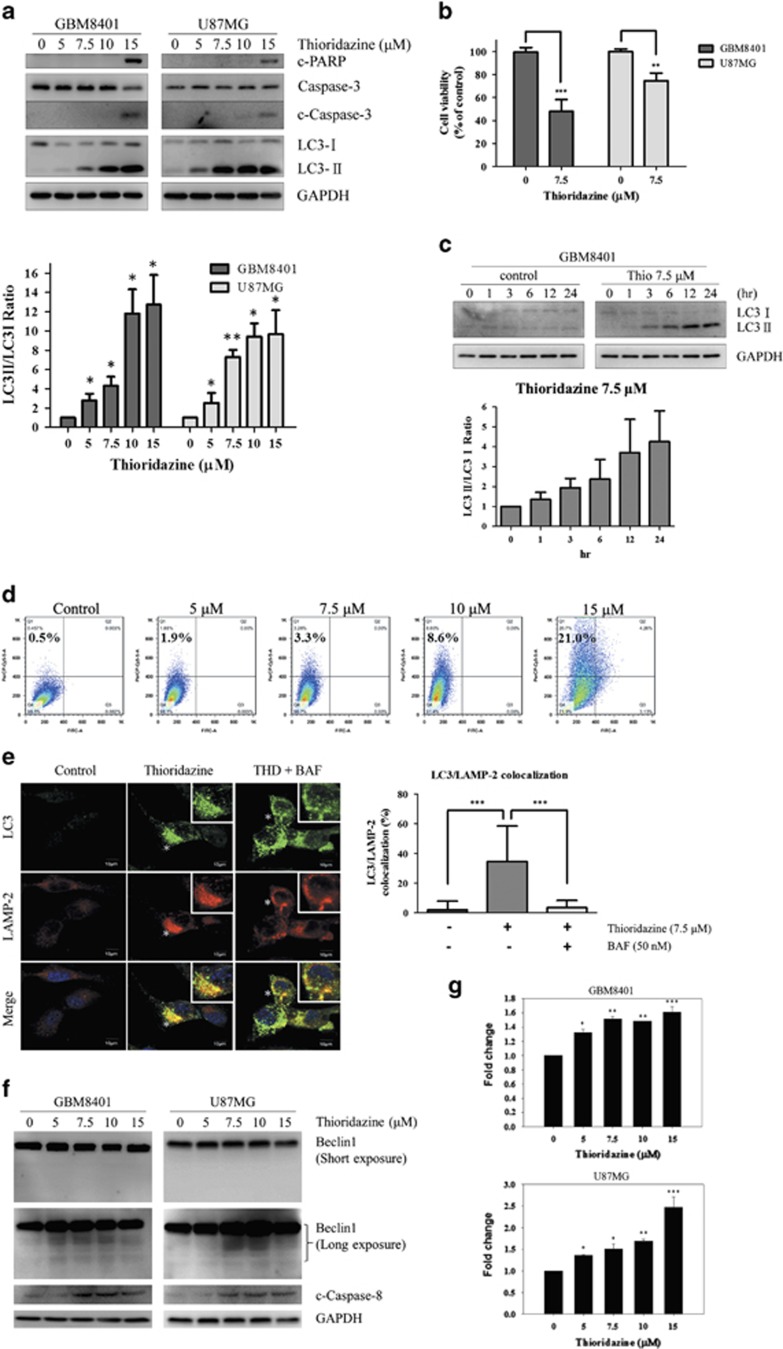
Thioridazine induces autophagy in GBM cells. (a) GBM8401 and U87MG cells were treated with thioridazine at 5, 7.5, 10 and 15 μM for 24 h, respectively. c-PARP, Caspase-3, c-Caspase-3, LC3-I and LC3-II were detected by western blotting. GAPDH was used as an internal control. The intensity of LC3-II band density was normalized to LC3I, showing the conversion rate of LC3-I to LC3-II. Bar graph represents the mean of triplicates±S.D. *P<0.05, **P<0.01 compared with the control group. (b) GBM8401 and U87MG cells were treated with 7.5 μM thioridazine for 24 h. Bar graph represents the mean of triplicates±S.D. **P<0.01, ***P<0.005 compared with the control group. (c) GBM8401 cells were treated with thioridazine at 7.5 μM for 1, 3, 6, 12 and 24 h, respectively. LC3-I and LC3-II were detected by western blotting. GAPDH was used as an internal control. The intensity of LC3-II band density was normalized to LC3I, showing the conversion rate of LC3-I to LC3-II. (d) GBM8401 cells were treated with thioridazine at 5, 7.5, 10 and 15 μM for 24 h, respectively. Acridine orange-positive cells were quantified by using flow cytometry. Bar graph represents the mean of triplicates±S.D. **P<0.01 compared with the control group. (e) U87MG cells were pretreated with or without 50 nM Bafilomycin A1 for 4 h, and then treated with 7.5 μM thioridazine for 24 h. Cells were stained with antibodies against LC3 (green) and LAMP-2 (red). Asterisk indicates the colocalization of LC3 and LAMP-2 (yellow). Inset shows magnified view of colocalizations. All merged images together with DAPI staining of DNA (blue). Colocalization was analyzed by confocal microscopy ( × 60 magnification). Bar graph represents the mean of duplicates±S.D., as quantified in at least 25 cells for each experimental condition. ***P<0.005. Bars=10 μm. BAF, Bafilomycin A1. (f) U87MG and GBM 8401 were treated with thioridazine for 24 h. After treatment, the cleavage of beclin1 and caspase-8 was detected using immunoblotting. The GAPDH was used as an internal control. (g) U87MG and GBM 8401 were treated with thioridazine for 24 h. The activity of caspase-8 was determined using luminescence. Bar graph represents the mean of triplicates±S.D. *P<0.05, **P<0.01, ***P<0.005. compared with the control group

