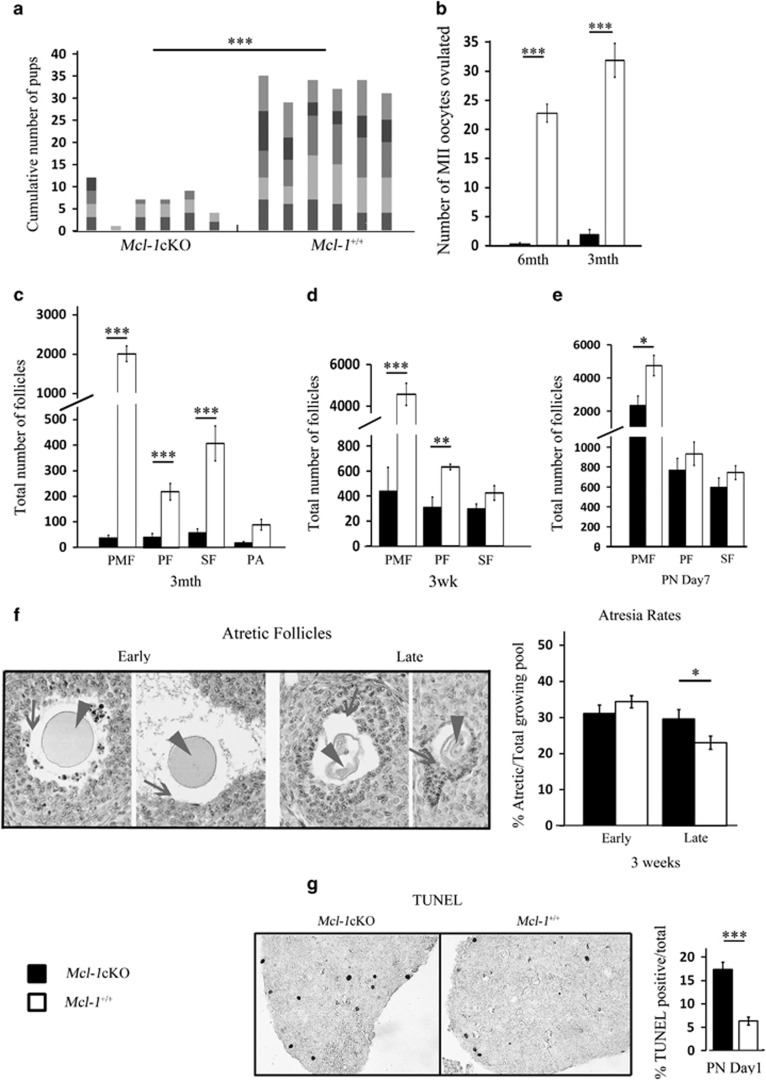
Figure 2.
Breeding performance, ovulation rates and histomorphometric analyses of ovaries. (a) Cumulative pup number from Mcl-1cKO (n=6) and Mcl-1+/+(n=6) females bred with wild-type males at 4 weeks for 6-month trial. Columns represent individual females with each varied color segment indicative of individual litters. (b) Ovulation rates from primed 6-month Mcl-1cKO (n=12), compared with Mcl-1+/+ (n=18) control females and 3-month Mcl-1cKO (n=20), compared with Mcl-1+/+ (n=12) females. Values represent average oocytes ovulated per female±S.E.M. (c) Histomorphometric analyses of PMF, PF, SF and PA follicles in 3-month Mcl-1cKO (n=5), compared with Mcl-1+/+ (n=3) females; (d) in 3-week ovaries of Mcl-1cKO (n=5) to Mcl-1+/+ (n=4) females; (e) and in day 7 (PN7) Mcl-1cKO (n=4), compared with Mcl-1+/+ (n=4) females. Values in c, d and e represent average number of follicles/ovary±S.E.M. (f) Representative stages of follicle atresia (left) in ovarian sections stained with methyl green, display granulosa cell death/detachment (arrows) preceding oocyte shrinkage (arrowhead). Both early and late-stage follicle atresia rates of Mcl-1cKO (n=4), compared with Mcl-1+/+ (n=5) ovaries. Atretic follicles were taken as a proportion of the total post-secondary growing follicles and separated into advanced stage (late) or early/moderate stage follicle atresia. (g) Death rates based on TUNEL stain of PN1 ovaries of Mcl-1cKO (n=4) compared with Mcl-1+/+ (n=3) females counterstained with methyl green. Values represent average percentage of TUNEL positive/total PMF per section±S.E.M. Significance denoted by number of stars (*P<0.05, **P<0.01, ***P<0.001). Genotypes in legend apply to all graphs

