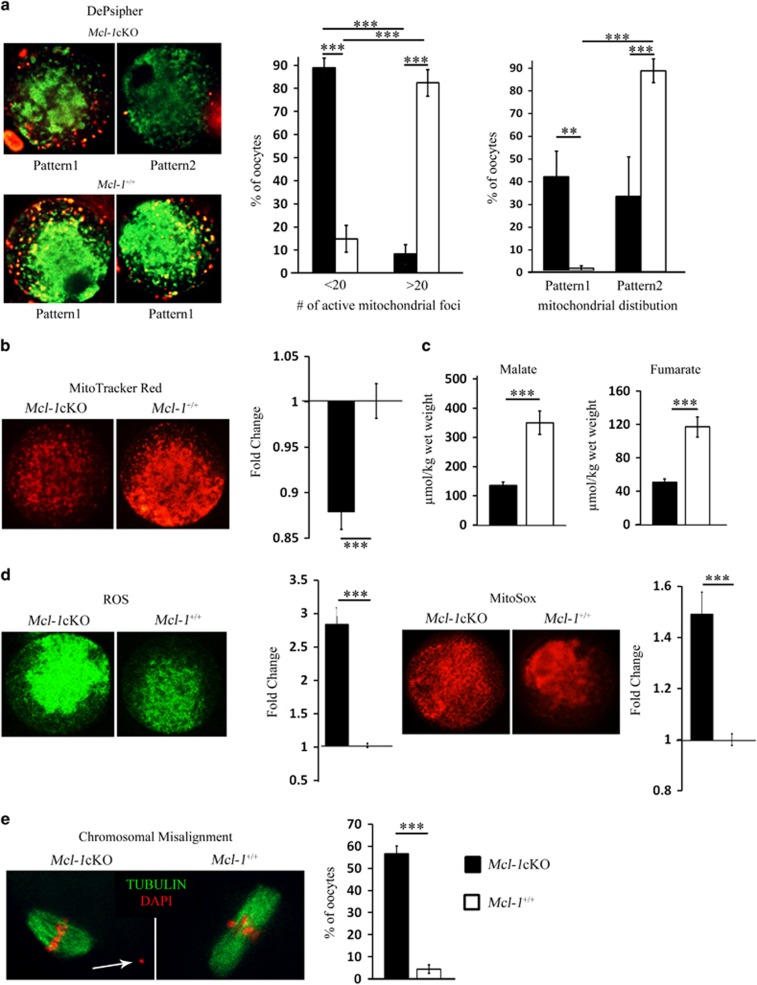
Figure 4.
Markers of mitochondrial function and chromosomal alignment. (a) Mcl-1cKO (n=57) and Mcl-1+/+ (n=85) MII oocytes were stained with a potential dependent mitochondrial dye (DePsipher). Values in graph (left) represent a proportion (%) of oocytes with few (<20) or numerous (>20) polarized (red) mitochondrial foci±S.E.M. per Mcl-1cKO or Mcl-1+/+ oocytes. Values in graph (right) represent the proportion (%) of oocytes with mitochondrial distribution separated into pattern 1 or pattern 2±S.E.M. (b) Mean intensity of Mcl-1cKO (n=68) and Mcl-1+/+ (n=52) MII oocytes stained with MitoTracker Red. Values represent average fold change±S.E.M. of relative fluorescence units (RFUs) per oocyte, normalized to wild type. (c) Mcl-1cKO (n=15) and Mcl-1+/+ (n=15) oocytes were assayed for levels of TCA cycle substrates malate and fumarate. Values represent average metabolite level (μmol) per oocyte wet weight (kg)±S.E.M. (d) MII oocytes were stained with DCFDA (green) (Mcl-1cKO (n=20) and Mcl-1+/+ (n=17)) or with MitoSox (red) (Mcl-1cKO (n=20) and Mcl-1+/+ (n=24)). Values represent average fold change±S.E.M. of RFUs per oocyte, normalized to wild type. (e) MII oocytes were stained with DAPI (red) and anti-tubulin (green) to visualize chromatin and spindle; chromosomal misalignments (white arrow) from Mcl-1cKO (n=84) and Mcl-1+/+ (n=89) oocytes were quantitated. Values represent percentage of oocytes with misaligned chromosomes/total oocyte pool. (*P<0.05, **P<0.01, ***P<0.001). Genotypes in legend apply to all graphs

