Figure 6.
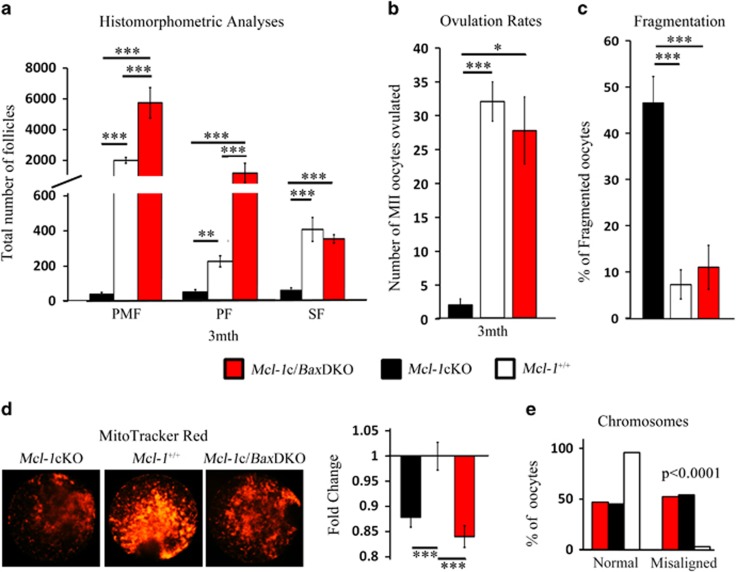
Rescue of Mcl-1-deficient follicle loss by concurrent Bax ablation. (a) Histomorphometric analyses of 3-month ovaries in Mcl-1cKO (n=5), Mcl-1+/+(n=3) and Mcl-1c/BaxDKO (n=3) females. Values represent average follicle number in ovary per genotype±S.E.M. (b) Ovulation rates of Mcl-1cKO (n=20), Mcl-1+/+(n=12) and Mcl-1c/BaxDKO (n=3) 3-month females. Values represent average number of ovulated oocytes±S.E.M. (c) MII oocytes from Mcl-1cKO (n=6), Mcl-1+/+(n=10) and Mcl-1c/BaxDKO (n=3) females (n=104, n=180, n=48 oocytes, respectively) cultured for 24 h and values represent the average percentage of fragmented oocytes per female±S.E.M. (d) Mcl-1cKO (n=50), Mcl-1+/+(n=33), and Mcl-1c/BaxDKO (n=49) MII oocytes were stained with MitoTracker Red. Values represent fold change of average RFUs per oocyte±S.E.M. normalized to average Mcl-1+/+ value. (e) Chromosomal misalignments in Mcl-1cKO (n=70), Mcl-1+/+ (n=89) and Mcl-1c/BaxDKO (n=19) oocytes were quantitated (from n=4, n=5 and n=2 animals, respectively). Values represent percentage of oocytes with misaligned or normal chromosomes/total oocyte pool. Mcl-1c/BaxDKO data were all graphed against Mcl-1cKO and Mcl-1+/+data from Figures 2,4 and 5. (*P<0.05, **P<0.01, ***P<0.001). Genotypes in legend apply to all graphs

