Figure 5.
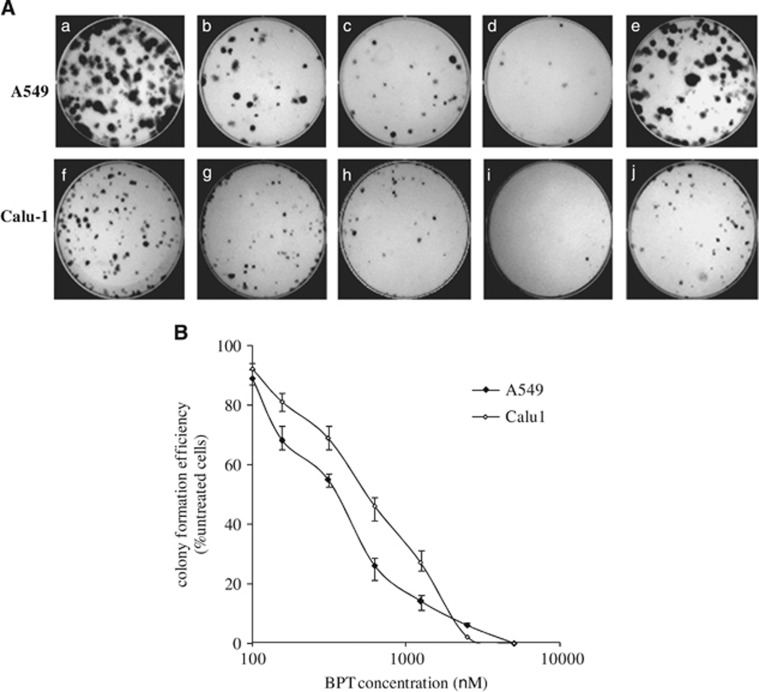
Long-term survival of cancer cells after the treatment with BPT. A549 and Calu-1 cells were investigated for their long-term survival efficiency after treatment with different concentrations of BPT. The colony formation efficiency is expressed as the percentage of colonies formed in the treated cultures compared with untreated cultures. (A) The representative plates show A549 untreated (a), treated with BPT, 0.5 μM (b), treated with BPT, 1 μM (c), treated with BPT, 2.5 μM (d) and treated with fascaplysin, 0.8 μM (e); Calu-1 untreated (f), treated with BPT, 0.5 μM (g), treated with BPT, 1 μM (h), treated with BPT, 2.5 μM (i) and treated with fascaplysin, 1 μM (j). (B) The curves representing colony formation efficiencies of A549 and Calu-1 cells with increasing concentrations of BPT. All results are represented by means±S.D. obtained from three independent experiments

