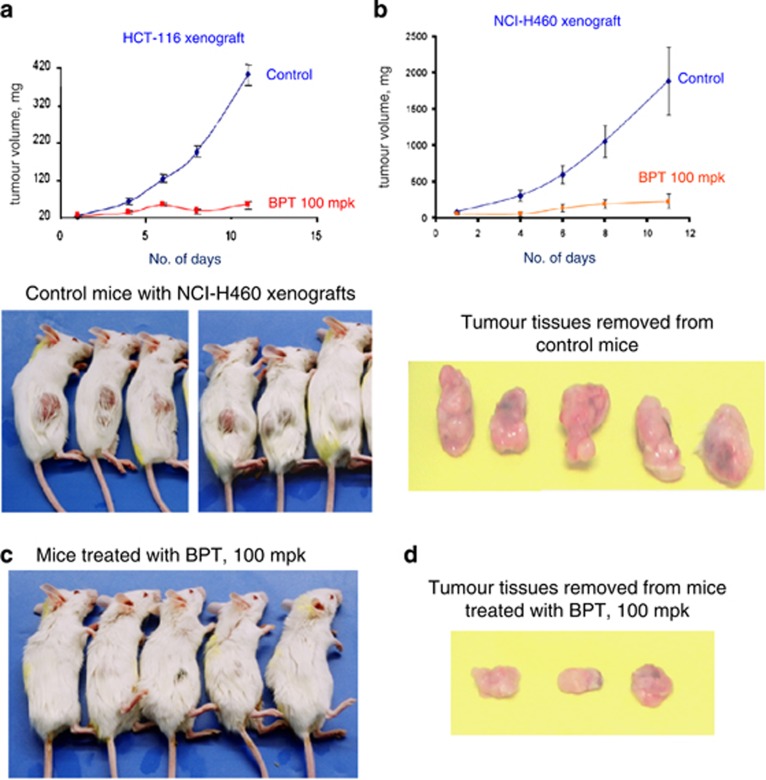
Figure 6.
(a) In vivo tumour growth inhibition curve for BPT in the SCID mice-HCT-116 xenograft model. Graphs depict tumour growth inhibition in a group of animals treated with BPT at the concentration 100 mpk, which is compared with the untreated group of animals (shown in the graphs as the control group). Tumour sizes were recorded at 2–5 day intervals. Tumour weight (in mg) was estimated according to the formula for a prolate ellipsoid: (length (mm) × (width (mm)2) × 0.5) assuming specific gravity to be one and π to be three. (b) Tumour growth inhibition curves for BPT in the SCID mice-NCI-H460 xenograft model. Graphs depict tumour growth inhibition in a group of animals treated with BPT compared with the untreated group of animals (shown in the graphs as the control group). Tumour sizes were recorded at 2–5 day intervals. Tumour weight (in mg) was estimated according to the formula for a prolate ellipsoid: (length (mm) × (width (mm)2) × 0.5) assuming specific gravity to be 1 and π to be 3. (c) The pictures of SCID mice showing NCI-H460 tumour growth inhibition followed by treatment with BPT at the concentration 100 mpk. The treatments were continued for 9 consecutive days intraperitoneally when tumour growth had reached about 4–6 mm in diameter after about 6 days following the tumour cell injection. (d) Pictures of NCI-H460 tumour tissues, from SCID mice, exhibiting tumour growth inhibition by BPT

