Figure 1.
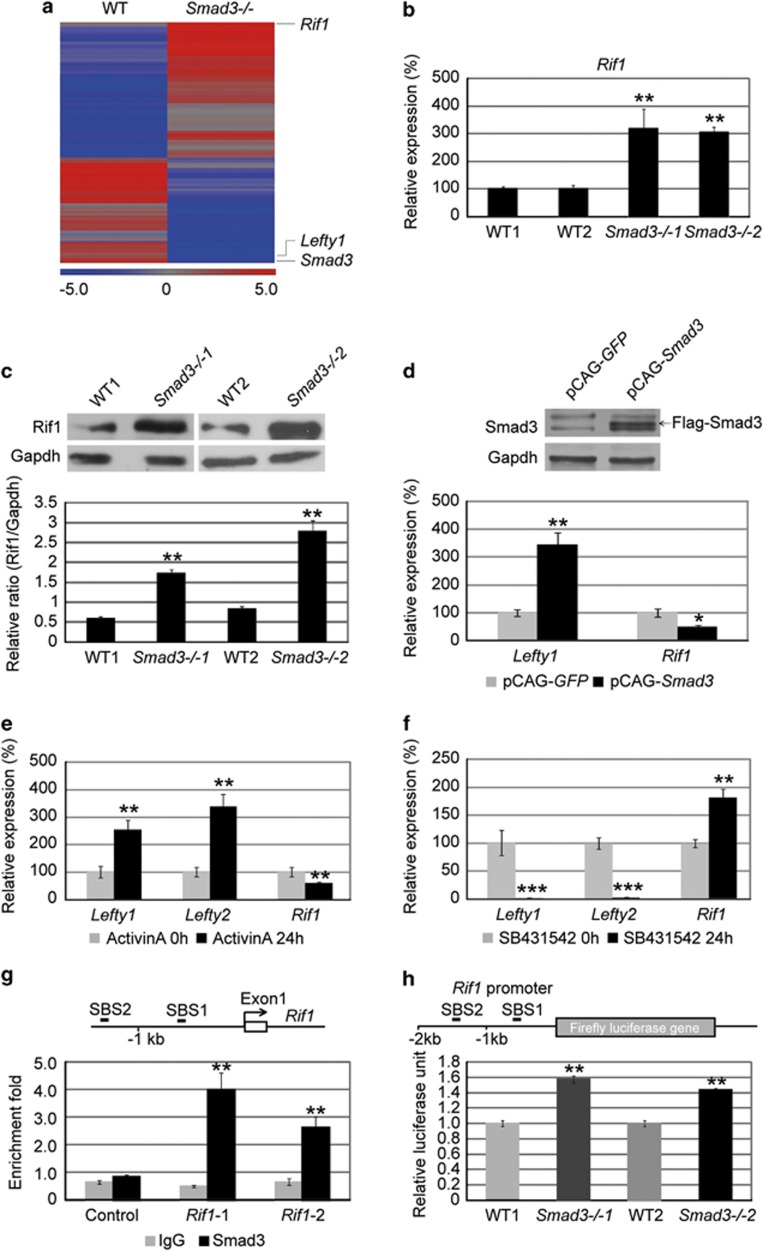
Smad3 represses Rif1 expression in ESCs. (a) The heat map shows the expression profile of genes with mRNA level increased or decreased for more than 1.5-fold in Smad3−/− ESCs compared with WT ESCs. Lefty1 and Smad3 are decreased, whereas Rif1 is increased in Smad3−/− ESCs compared with WT ESCs. (b) Quantitative real-time PCR to examine the mRNA level of Rif1 in WT and Smad3−/− ESCs. Actin was analyzed as an internal control. The data are shown as the mean±S.D. (n=3). (c) Western blot and densitometric analyses of the expression of Rif1 in WT and Smad3−/− ESCs. Gapdh expression level was used as an internal control. The data are shown as the mean±S.D. (n=2). (d) Western blot analysis of Smad3 (upper layer) and real-time PCR analysis of Lefty1 and Rif1 (lower layer) in pCAG-GFP- and pCAG-Smad3-transfected Smad3−/− ESCs. Gapdh protein level and Actin expression level were used as internal controls for the western blot and real-time PCR analysis, respectively. Arrow indicates the overexpression band of Flag-Smad3. The real-time PCR data are shown as the mean±S.D. (n=3). (e) Quantitative real-time PCR to examine mRNA expression levels of Lefty1, Lefty2 and Rif1 in mouse ESCs with Activin A (25 ng/ml) treatment for 0 and 24 h. Actin was analyzed as an internal control. The data are shown as the mean±S.D. (n=3). (f) Quantitative real-time PCR to examine mRNA expression levels of Lefty1, Lefty2 and Rif1 in mouse ESCs with SB431542 (10 μM) treatment for 0 and 24 h. Actin was analyzed as an internal control. The data are shown as the mean±S.D. (n=3). (g) ChIP-qPCR to examine Smad3 and IgG enrichment on the promoter of Rif1. The sketch of Smad3-binding sites on the promoter of Rif1 has been indicated (SBS1 and SBS2), Rif1-1 and Rif1-2 regions cover SBS1 and SBS2, respectively. Protein enrichment on Actin was analyzed as a control. The data are shown as the mean±S.D. (n=3). (h) Luciferase assay to examine Rif1 promoter activity in WT and Smad3−/− ESCs at 48 h after transfection. Two kb Rif1 promoter was cloned in front of firefly luciferase reporter. Renilla was analyzed as an internal control. The data are shown as the mean±S.D. (n=3). Statistically significant differences, calculated through student's t-tests, are indicated (*P<0.05; **P<0.01; ***P<0.001)

