Figure 2.
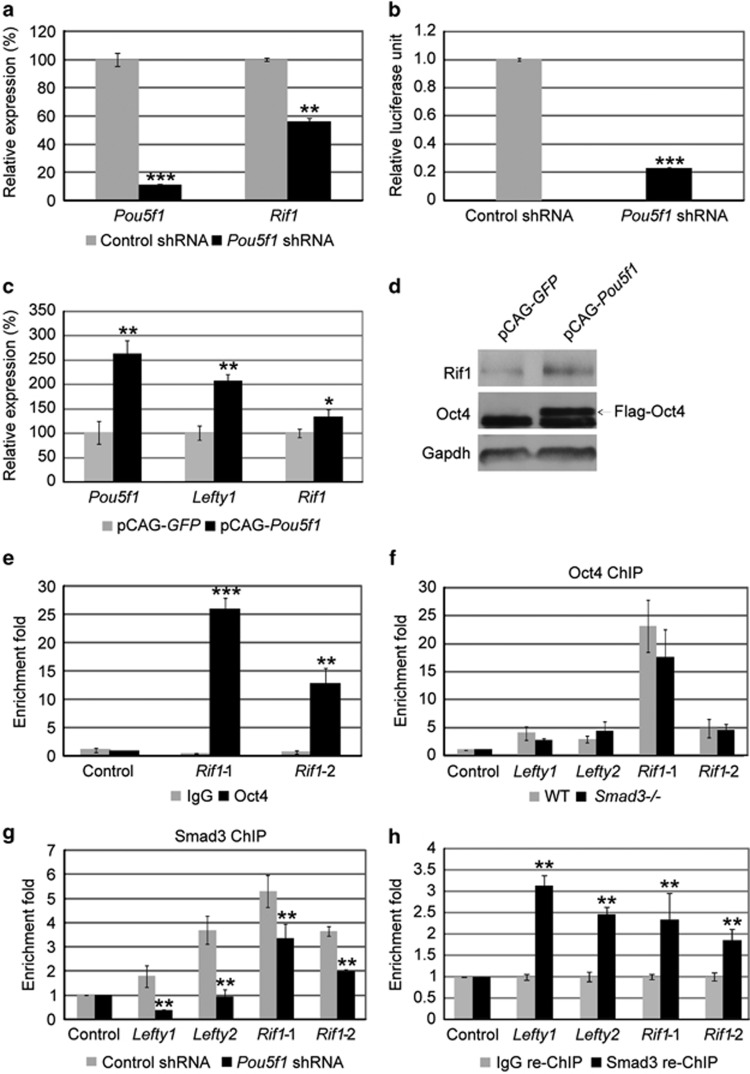
Oct4 positively regulates Rif1 and is indispensable for Smad3 to bind to Rif1 promoter regions. (a) Quantitative real-time PCR to examine the mRNA levels of Pou5f1 and Rif1 after transfection with pSuper control and pSuper-Pou5f1-shRNA plasmids. Actin was analyzed as a control. The data are shown as the mean±S.D. (n=3). (b) Luciferase assay to examine Rif1 promoter activity in mouse ESCs transfected with pSuper control and pSuper-Pou5f1-shRNA plasmids. Renilla was analyzed as an internal control. The data are shown as the mean±S.D. (n=3). (c) Quantitative real-time PCR to examine the mRNA levels of Pou5f1, Lefty1 and Rif1 after transfection with pCAG-GFP and pCAG-Pou5f1 plasmids. Actin was analyzed as a control. The data are shown as the mean±S.D. (n=3). (d) Western blot analysis of the protein levels of Oct4 and Rif1 in mouse ESCs transfected with pCAG-GFP and pCAG-Pou5f1 plasmids. Gapdh was analyzed as a control. Arrow indicates the overexpression band of Flag-Oct4. (e) ChIP-qPCR to examine the DNA enrichment of Oct4 and control IgG at the Smad3-binding sites on the promoter of Rif1 in mouse ESCs. Enrichment of studied proteins on Actin was analyzed as a control. The data are shown as the mean±S.D. (n=3). (f) ChIP-qPCR to examine the Oct4 enrichment at the Lefty1, Lefty2 and Rif1 in WT and Smad3−/− ESCs. Actin was analyzed as a control. The data are shown as the mean±S.D. (n=3). (g) ChIP-qPCR to examine Smad3 enrichment at the Lefty1, Lefty2 and Rif1 at 1-day puromycin selection after mouse ESCs were transfected with pSuper control and pSuper-Pou5f1-shRNA plasmids. Smad3 enrichment at Actin was analyzed as a control. The data are shown as the mean±S.D. (n=3). (h) Sequential ChIP assay was performed to examine Smad3 and IgG enrichment on Oct4-enriched DNAs. The quantity of enriched Lefty1, Lefty2 and Rif1 (Rif1-1 and Rif1-2) fragments was checked by real-time PCR. The data are shown as the mean±S.D. (n=3). Statistically significant differences, calculated through student's t-tests, are indicated (*P<0.05; **P<0.01; ***P<0.001)

