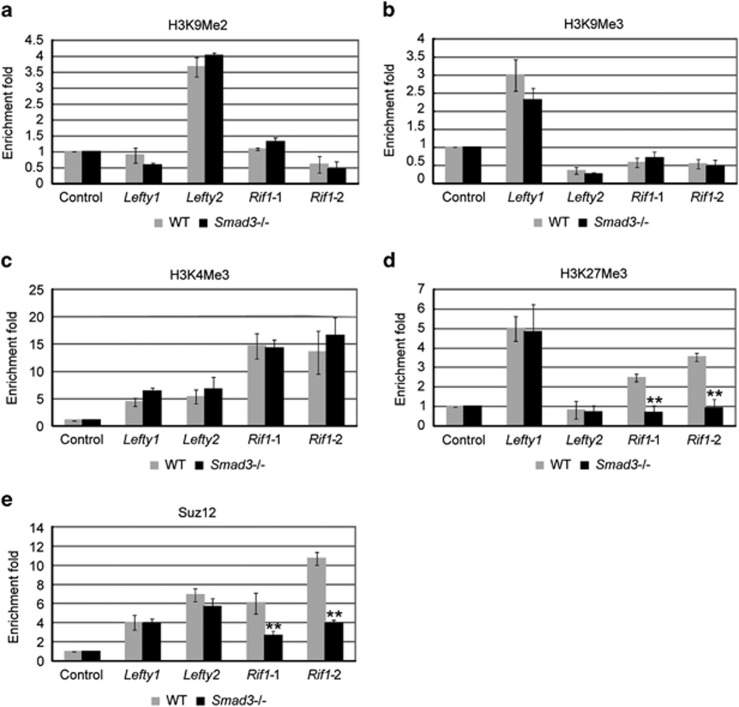
Figure 3.
Rif1 promoter shows Smad3-dependent H3K27 methylation ChIP-qPCR to examine (a) H3K9me2, (b) H3K9me3, (c) H3K4Me3, (d) H3K27Me3 and (e) Suz12 enrichment at Lefty1 and Lefty2 enhancer and Rif1 promoter in WT and Smad3−/− ESCs. Enriched Actin was analyzed as a negative control. The data are shown as the mean±S.D. (n=3). Statistically significant differences, calculated through student's t-tests, are indicated (*P<0.05; **P<0.01; ***P<0.001)

