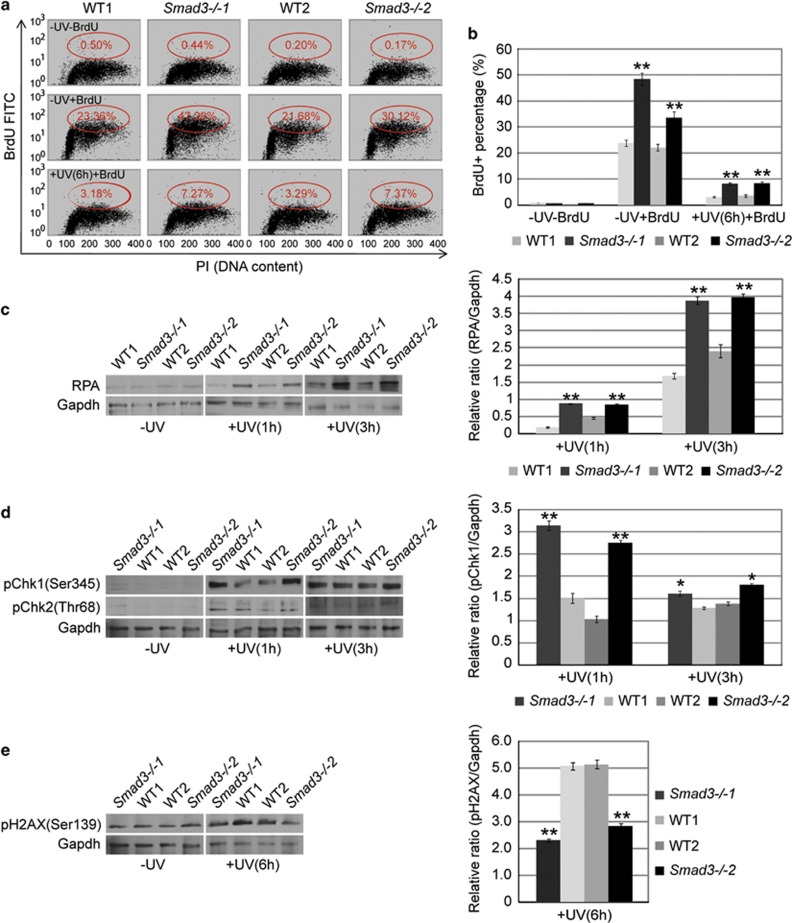
Figure 4.
Smad3−/− ESCs show enhanced cell proliferation and DNA repair capacity after UV irradiation. (a) Representative flow cytometry dot plot of BrdU-integrated WT (WT1 and WT2) and Smad3−/− (Smad3−/−1 and Smad3−/−2) ESCs at 0 and 6 h after UV irradiation. x axis represents DNA content through PI stain and y axis represents BrdU-FITC-labeled cells. (b) Statistical analysis of the BrdU-positive cell percentage of a from two independent experiments. The data are shown as the mean±S.D. (n=2). (c) Western blot and densitometric analyses of the expression of RPA2 in WT (WT1 and WT2) and Smad3−/− (Smad3−/−1 and Smad3−/−2) ESCs before, and at 1 and 3 h after, UV (40 mJ/cm2) irradiation. Gapdh expression level was used as an internal control. The densitometric data are shown as the mean±S.D. (n=2). (d) Western blot and densitometric analyses of the expression of pChk1 (Ser345) and pChk2 (Thr68) in WT (WT1 and WT2) and Smad3−/− (Smad3−/−1 and Smad3−/−2) ESCs before, and at 1 and 3 h after, UV (40 mJ/cm2) irradiation. Gapdh expression level was used as an internal control. The densitometric data are shown as the mean±S.D. (n=2). (e) Western blot and densitometric analyses of the expression of pH2AX (Ser139) in WT (WT1 and WT2) and Smad3−/− (Smad3−/−1 and Smad3−/−2) ESCs before, and at 6 h after, UV (40 mJ/cm2) irradiation. Gapdh expression level was used as an internal control. The data are shown as the mean±S.D. (n=2). Statistically significant differences, calculated through student's t-tests, are indicated (*P<0.05; **P<0.01; ***P<0.001)

