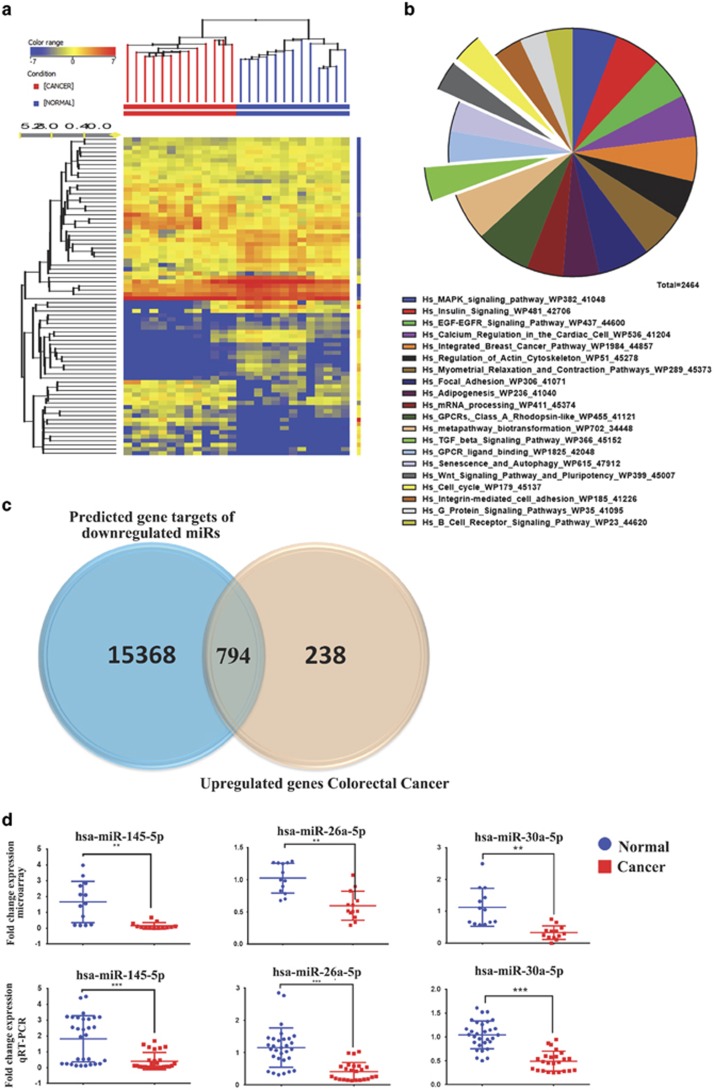
Figure 2.
miRNA expression profiling in CRC. (a) Hierarchical clustering of 13 colon cancer and 13 normal tissue samples based on miRNA expression levels. Each column represents a sample and each row represents a transcript. Expression level of each miRNA in a single sample is depicted according to the color scale. (b) Pie chart illustrating the distribution of the top 20 pathway designations for predicted targets (TargetScan) for the downregulated miRNAs in colon cancer. The pie size corresponds to the number of matched entities. (c) Venn diagram depicting the overlap between the predicted gene targets for the downregulated miRNAs (based on TargetScan) versus the differentially upregulated genes in CRC identified in the current study. (d) Expression levels of selected miRNAs (hsa-miR-145-5p, hsa-miR-26a-5p, and hsa-miR-30-5p) based on microarray data and validation of those miRNAs using Taqman qRT-PCR (duplicate). **P<0.005; ***P<0.0005

