Figure 3.
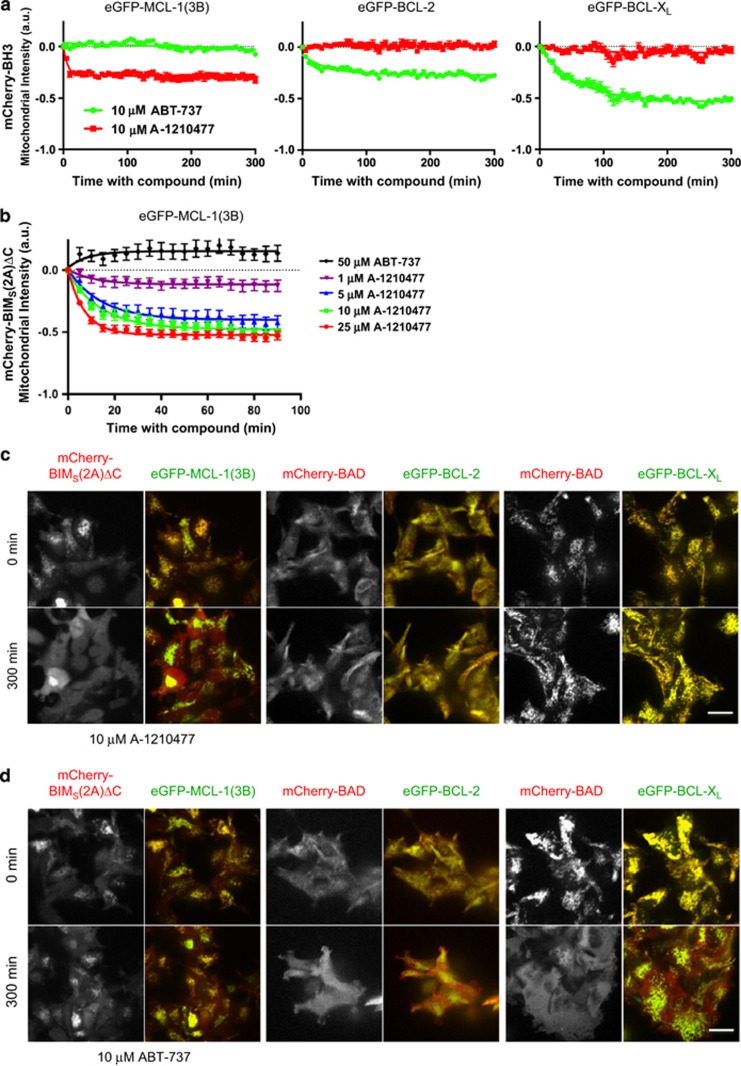
A-1210477 inhibits MCL-1-BIM complexes in live cells. (a) T-REx-293 cells stably expressing eGFP-MCL-1(3B) and mCherry-BIMS(2A)ΔC, eGFP-BCL-2 and mCherry-BAD, or eGFP-BCL-XL and mCherry-BAD were treated with 10 μM ABT-737, A-1210477, or dimethyl sulfoxide (DMSO) and imaged for 300 min. Compounds were added after acquisition of first image. The decrease in amount of mCherry-BH3 protein localized to the mitochondria was quantified as a function of time as described in the Materials and Methods, normalized to DMSO control, and fitted to a single exponential decay. Each data point represents the mean change in intensity calculated from 10 fields of view, with error bars indicating the S.E.M. (b) T-REx-293 cells stably expressing eGFP-MCL-1(3B) and mCherry-BIMS(2A)ΔC were treated with 50 μM ABT-737 or increasing concentrations (1–25 μM) A-1210477 for 100 min. The decrease in amount of mCherry-BIMS(2A)ΔC localized to the mitochondria was quantified as in panel (a). (c) Representative fluorescence microscopic images of T-REx-293 cells stably expressing eGFP-BCL-2 family and interacting mCherry-BH3-only proteins before and after 300 min of treatment with 10 μM A-1210477 or (d) ABT-737. Grayscale images show the mCherry-fusion proteins only, which were pseudocolored red in the overlay with the eGFP-fusion proteins (pseudocolored green). Scale bar represents 25 μm

