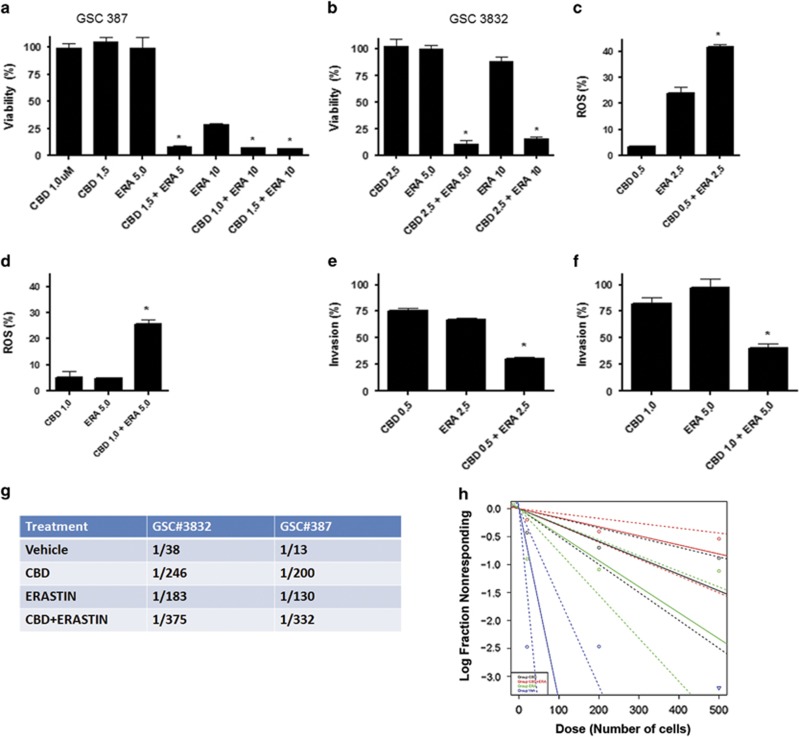
Figure 7.
CBD and ERA synergistically inhibit GSC viability, invasion and self-renewal. (a and b) GSC lines 387 and 3832 were treated with CBD, ERA or CBD+ERA (μM). Viability (%) was calculated as the Dojindo reagent product absorbance in the treated cells/control cells × 100. These data were used to calculate a CI value (0.53 and 0.49 for GSC 387, and 0.89 and 0.85 for GSC 3832) for the two combined concentrations in each group, where a CI value of <1, 1 and >1 indicates synergistic, additive and antagonistic effects, respectively (see also Supplementary Table 1). (c and d) ROS measurements show the combination of CBD+ERA (μM) enhanced ROS production in the 3832 and 387 GSC lines. ROS was measured using 2′,7′dichloro-dihydrofluorescein and cell flow cytometry. The % increase in ROS was calculated as the FL2 emission shift in treated cells/vehicle cells × 100. (e and f) Invasion assays were performed using GSC 387, GSC 3832 in the presence of vehicle, CBD, ERA and combination of CBD+ERA (μM). Invasion (%) was calculated as the number of cells invading in the treated cells/control cells × 100. Data were compared using a one-way analysis of variance (ANOVA) with a corresponding Dunnett's post hoc test. *Statistically significant differences from control at P<0.05. (g and h) Limited dilution assays were performed using 3832 and 387 GSCs cultured in three decreasing cell densities. Inhibitors were added at the time of initial culturing (CBD=1.5 μM, ERA=5 μM). The number of wells with spheres was recorded 10 days following initial culturing and data were analyzed using ELDA software. The plot represents analysis for 387 cells; the chart includes estimated (median) stem cell frequency for both GSC lines in the presence of CBD, ERA and CBD+ERA (μM) as indicated. Overall test for stem cell frequency between any of the groups shown in (g and h) had a P-value of 2.2e−5

