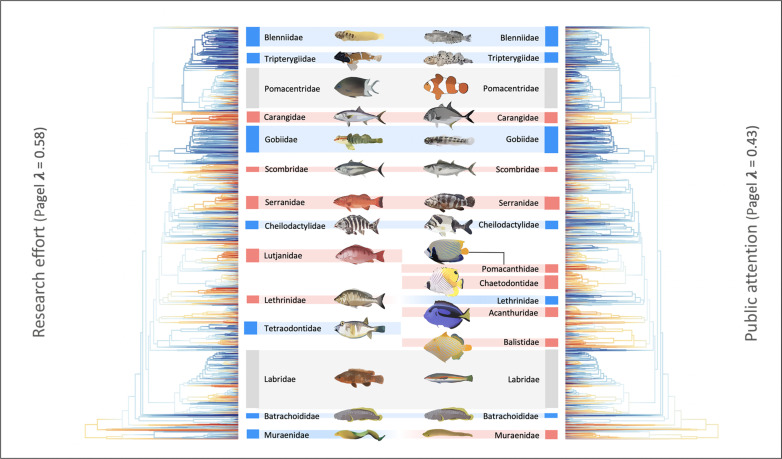
Fig. 4. Mapping the two dimensions of human interest for global reef fishes across their Tree of Life.
Research effort (left) and public attention (right) are mapped over the phylogenetic tree with a color gradient obtained by estimating states at internal nodes with maximum likelihood (91) from low (blue) to high (red) values. Pagel’s λ coefficient, which measures the importance of phylogenetic clustering, is given for both research effort and public attention (see Materials and Methods). For illustration, we highlighted families (using color bands in the middle of the figure) with contrasted research effort and public attention values (families with high values in red, low values in blue and contrasted values in gray). We provide illustrations of example fish species for each family (to illustrate higher, lower, or average values of human interest depending on which family was considered). In alphabetical order: Acanthuridae (Paracanthurus hepatus), Balistidae (Balistapus undulatus), Blenniidae (left, Omobranchus aurosplendidus; right, Entomacrodus solus), Batrachoididae (Daector schmitti), Carangidae (left, Seriola lalandi; right, Caranx ignobilis), Chaetodontidae (Chaetodon auriga), Cheilodactylidae (left, Goniistius rubrolabiatus; right, Cheilodactylus plessisi), Gobiidae (left, Tigrigobius harveyi; right, Gobiosoma hildebrandi), Labridae (left, Labrus bergylta; right, Coris julis), Lethrinidae (Lethrinus nebulosus), Lutjanidae (Lutjanus campechanus), Muraenidae (left, Gymnothorax funebris; right Gymnothorax javanicus), Pomacanthidae (Pomacanthus imperator), Pomacentridae (left, Acanthochromis polyacanthus; right Amphiprion ocellaris), Scombridae (left, Rastrelliger kanagurta; right, Sarda sarda), Serranidae (left, Plectropomus leopardus; right, Epinephelus itajara), Tetraodontidae (Omegophora cyanopunctata), Tripterygiidae (left, Enneapterygius larsonae; right, Trianectes bucephalus). The drawings used to represent fishes were digitally created by N.M. and are CC0 1.0.

