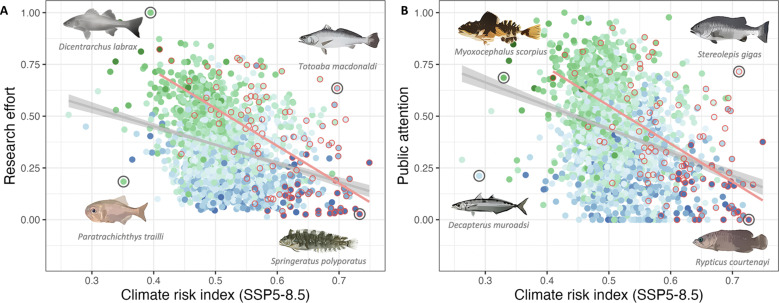
Fig. 6. Climate risk and human interest for global reef fishes.
Relationship between research effort and public attention with climate risk index as computed in (40) under the IPCC SSP5-8.5 scenario. For both (A) and (B), dot colors reflect species geographic ranges [log10 transformed and scaled between 0 and 1; from large (green) to narrow (blue) ranges; as in Fig. 2]. The gray lines show linear model regression with 95% confidence intervals (n = 2094, r = −0.3 for both research effort and public attention, P < 0.001). Dots surrounded by red circles are species considered as TH by the IUCN. The red lines show linear model regression for TH species (n = 106, r = −0.57 for research effort and r = −0.53 for public attention, P < 0.001). Examples of fishes are given at the four corners of the human interest and climate risk relationship. The drawings used to represent fishes were digitally created by N.M. and are CC0 1.0.

