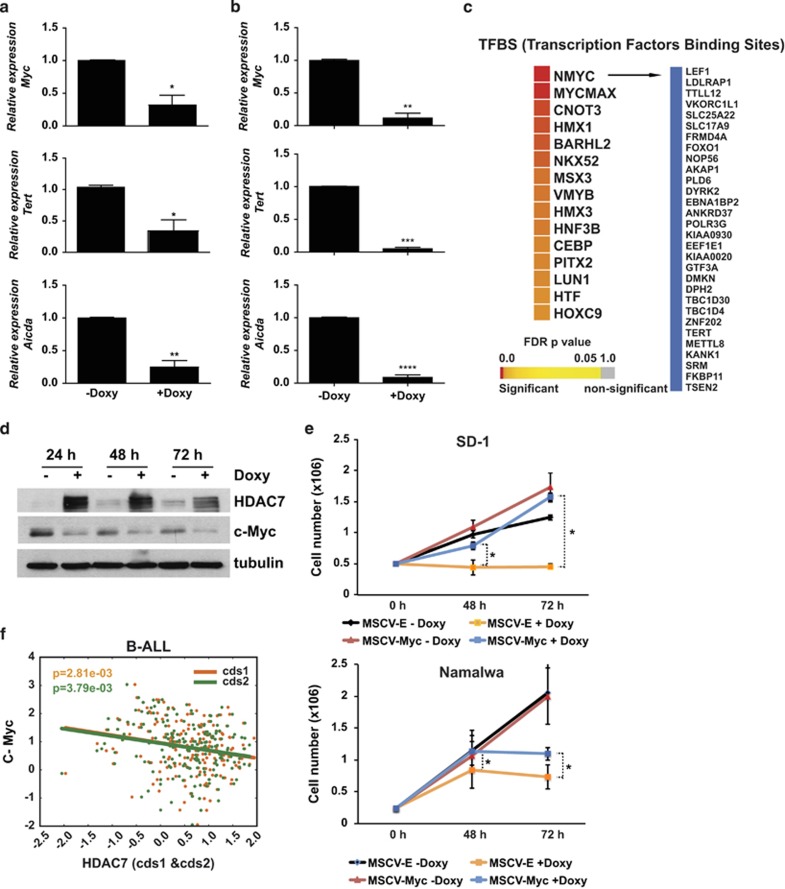
Figure 5.
HDAC7 leads to the repression of c-Myc in SD-1 and Namalwa cells. (a) and (b) RT-qPCR validation for selected downregulated genes in the presence of HDAC7 are shown in SD-1-1-Tet-On-Tight HDAC7 (a) SD-1 and Namalwa-Tet-On-Tight HDAC7 cells (b). *P<0.05; **P<0.01; ***P<0.001; ****P<0.0001. (c) TF-binding sites enriched in the downregulated genes after HDAC7 expression in SD-1 cells. Myc target genes are shown. (d) Western blot showing the downregulation of c-Myc after HDAC7 expression in SD-1 cells. (e) SD-1-Tet-On-Tight-HDAC7 and Namalwa-Tet-On-Tight-HDAC7 cells transduced with either MSCV-Empty or MSCV-c-Myc retroviral vectors were cultured and treated, or not, with doxycycline. At the indicated times after treatment, the cell number was assessed by cell counting. Trypan blue-dyed cells were omitted from the cell counts. Means±S.D. of the three independent experiments performed in triplicate. *P<0.05 (f) GSE34861 data were analyzed to determine any correlation between HDAC7 and c-MYC expression. c-MYC and HDAC7 probes were normalized with respect to values of healthy patients. The graph shows the negative correlation between c-MYC and HDAC7 (cds1 ρ=−2.15e-01; cds2 ρ=−2.09e-01) expression in the B-ALL patients

