Figure 4.
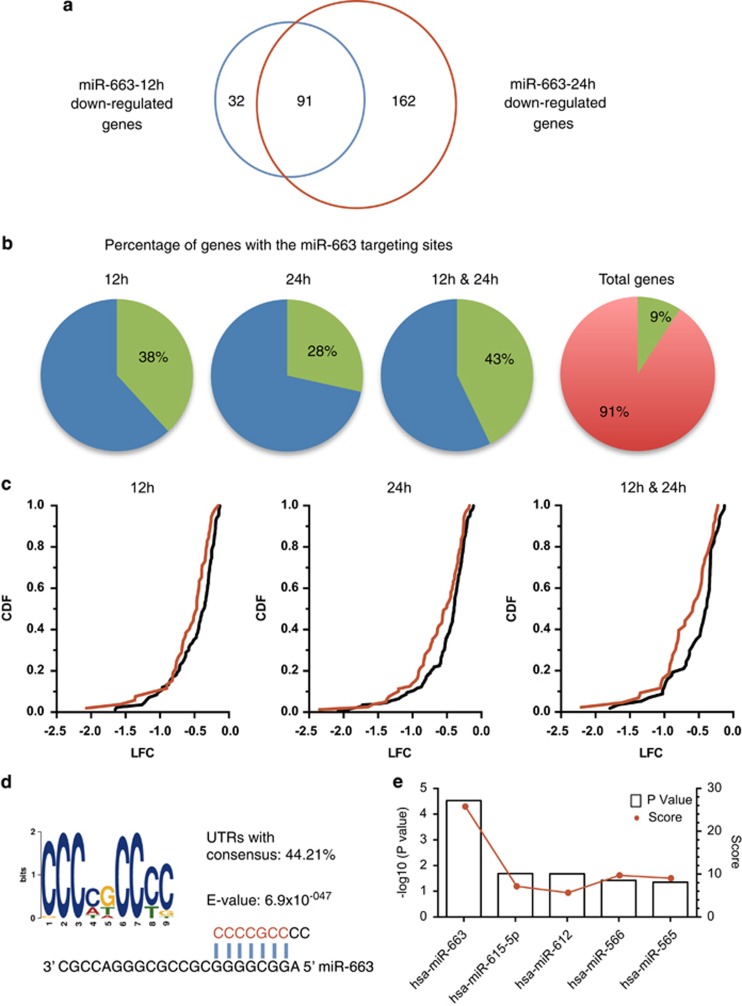
Multiple genes are downregulated after miR-663 mimics transfection in hNSCs. (a) Ninety-one genes are downregulated significantly downregulated (P<0.001) at both 12 and 24 h after miR-663 transfection. (b) Percentage of the genes containing miR-663 target sites predicted by Targetscan in the miR-663 microarray downregulated genes and total genes. (c) Cumulative distribution plots of log2-transformed gene expression fold changes (LFCs) for downregulated genes containing miR-663 target sites predicted by TargetScan (red) and all other downregulated genes (gray) after miR-663 transfection. The y axis shows cumulative distribution function (CDF) of LFC distribution. (P-values<0.05 by Wilcoxon test). (d) Representative motif found by MEME in the 3′-UTRs of the genes downregulated at both 12 and 24 h. The sequence logo of the weight matrix was constructed by MEME. (e) DIANA-mirExTra algorithm shows miR-663 hemxamers are enriched in the 3′-UTRs of the genes downregulated at both 12 and 24 h. The P-values and scores of the top five most significant miRNAs calculated with DIANA-microT are shown

