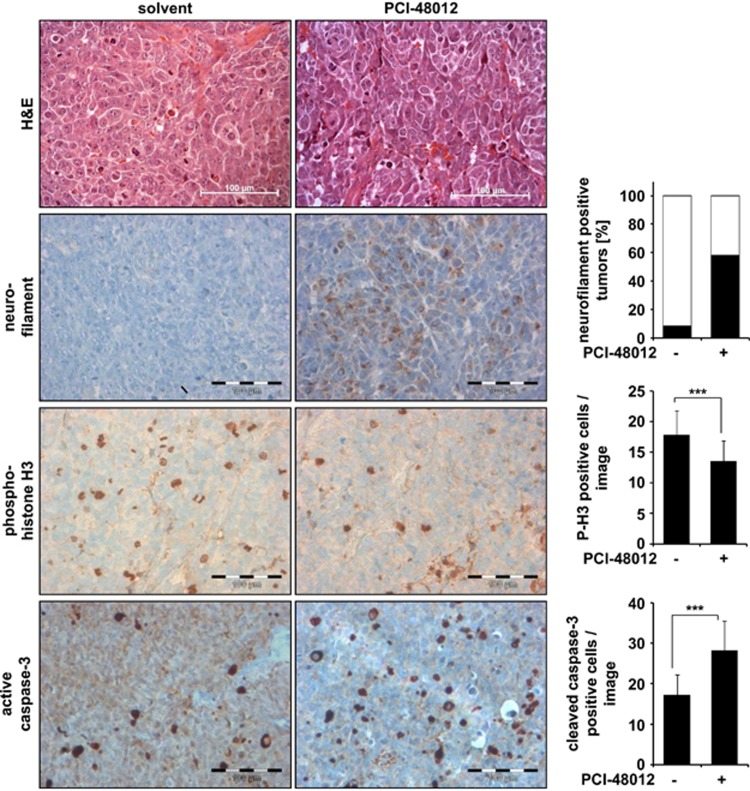
Figure 4.
Phenotype characterization of HDAC8 inhibitors in vivo. Shown are representative pictures from tumors of HDAC8-inhibitor-treated animals (PCI-48012 40 mg/kg per day) and solvent-treated animals. H&E-stained sections, magnification × 400. Neurofilament (brownish color); bar chart reflects the quantitative analysis of neurofilament-positive tumors (percentage). The quantification was carried out blinded to the treatment. Phosphorylated histone H3-positive cells (brownish color); bar chart reflects the quantitative analysis of phospho-histone H3-positive cell numbers; t-test was used for statistics; bars represent mean values of 60 pictures (12 tumors per treatment and 5 pictures per slide) and error bars represent S.D. Active caspase-3 (brownish color); bar chart reflects the quantitative analysis of caspase-3-positive cell numbers; t-test was used for statistics; bars represent mean values, error bars represent S.D. Scale bars=100 μm. Different regions are shown for the different stainings

