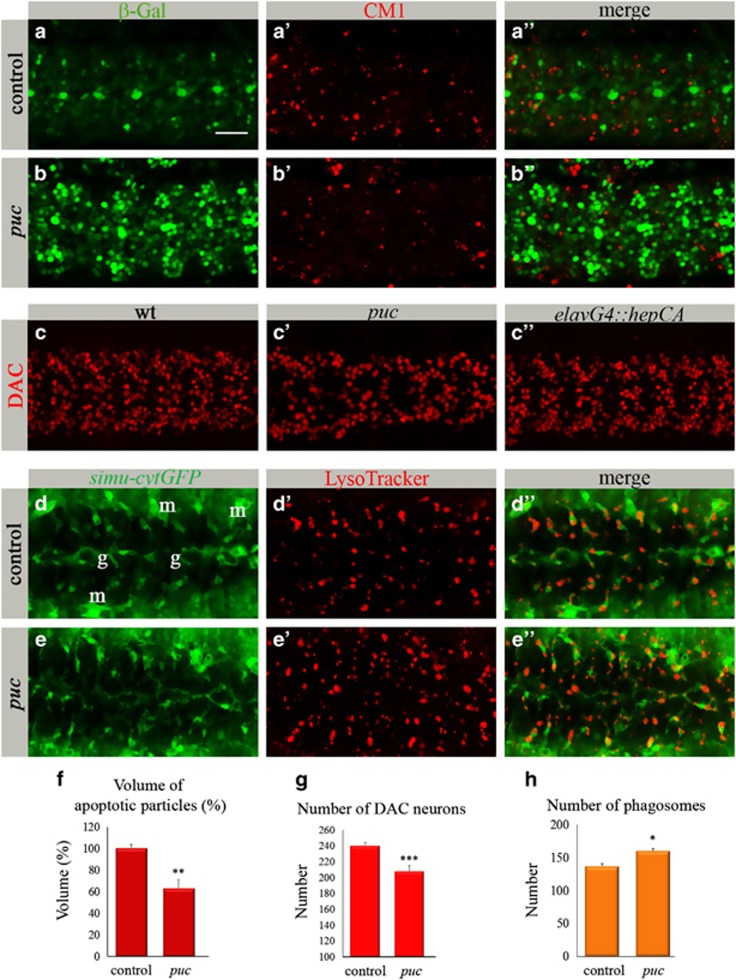
Figure 2.
Gain-of-function of the dJNK pathway reduces the volume of apoptotic particles in the CNS. (a–c″) Projections from confocal stacks of the embryonic CNS at stage 16; ventral view. Bar 20 μm. (a–b″) Embryos expressing puclacZ reporter stained with anti-β-Gal (green) and CM1 (red) antibodies. (a–a″) puclacZ heterozygous embryos as a control. (b–b″) puclacZ homozygous mutant embryos. (c–c″) Neurons labeled with anti-DAC (red). (d–e″) Projections from confocal stacks of the embryonic CNS of stage-16 live embryos; ventral view. simu-cytGFP reporter marks glia (g) and macrophages (m) in green. Phagosomes are marked with LysoTracker (red). (f) Volume of apoptotic particles within CNS sections. Columns represent mean total volume of apoptotic particles within confocal stacks of the CNS, ±S.E.M., n=7–8; asterisks indicate statistical significance versus control, as determined by the Student's t-test, **P<0.003. (g) Quantification of DAC-positive neurons. To count DAC-positive neurons, confocal stacks of the whole CNS (15 sections; total 22.5 μm) were acquired. Columns represent mean total number of DAC-positive neurons in three segments within confocal stacks of the CNS, ±S.E.M., n=8–15; asterisks indicate statistical significance versus control, as determined by the Student's t-test, ***P<0.0001. (h) Number of phagosomes within CNS sections. Columns represent mean total number of phagosomes within confocal stacks of the CNS, ±S.E.M., n=6–7; asterisks indicate statistical significance versus control, as determined by the Student's t-test, *P<0.04

