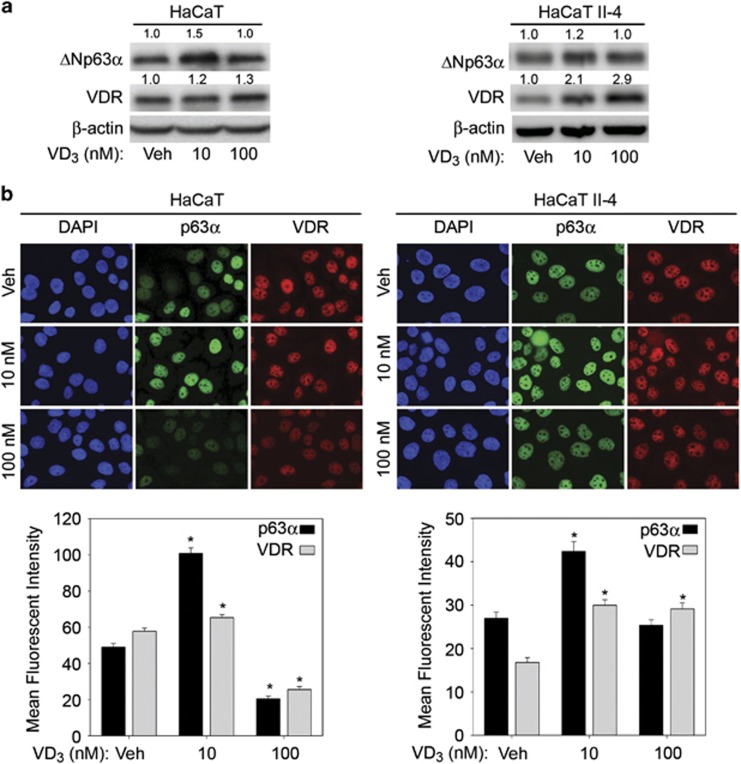
Figure 2.
VD3 dosage differentially affects ΔNp63α. (a) HaCaT and HaCaT II-4 cells were treated with vehicle, 10 nM VD3 or 100 nM VD3 for 24 h, and then subjected to immunoblot analysis for ΔNp63α, VDR and β-actin. The fold change in protein levels, relative to vehicle-treated cells, is listed above each band. (b) Top panel: HaCaT and HaCaT II-4 were treated with vehicle, 10 nM VD3 or 100 nM VD3 overnight followed by detection of p63α and VDR by immunofluorescence. Bottom panel: average mean fluorescent intensity of immunofluorescence staining for p63α and VDR in HaCaT and HaCaT II-4. Error bars represent standard error of the mean. *P values≤0.05 compared with vehicle control cells

