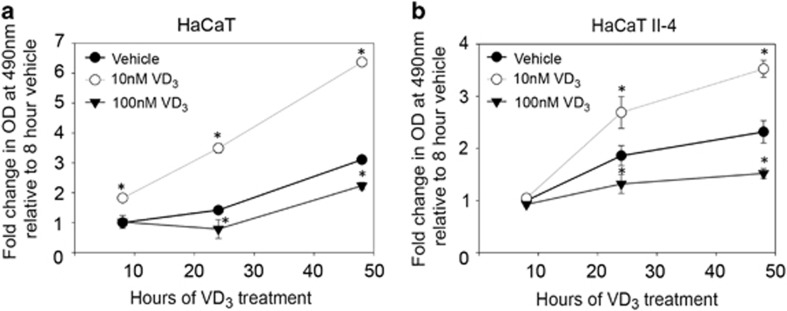
Figure 4.
VD3 dosage differentially affects cell proliferation. HaCaT (a) and HaCaT II-4 (b) cells were treated with vehicle, 10 nM VD3 or 100 nM VD3 for 8, 24 and 48 h, and cell proliferation was measured by MTS cell titer assay. Y axis represents fold change when compared with vehicle-treated cells. Error bars represent standard deviation from the mean. *P values≤0.05 compared with vehicle control cells

