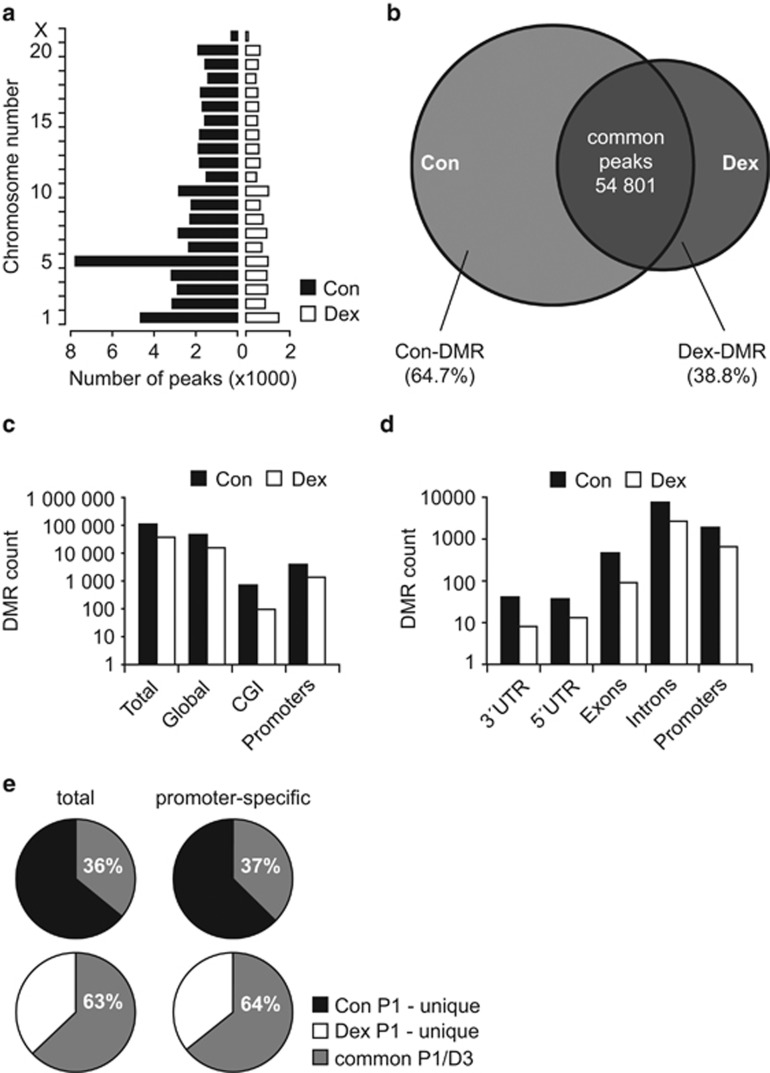
Figure 1.
Overview of MBD sequencing results. (a) Chromosomal distribution of methylation peaks in control and Dex-exposed NSCs. (b) Venn diagram depicting the proportions of common and unique methylation peaks (DMRs) in control and Dex-exposed P1 NSCs. (c) The DMRs of control and Dex-exposed NSCs were normalized to refGene. Note that the genome-wide DNA hypomethylation induced by Dex exposure affects CpG islands (CGI) and promoter regions to a similar extent. (d) The DMRs distributed within CGI of refGene show similar distribution in control and Dex-exposed NSCs. (e) The proportion of methylation sites that is consistent across passages (P1 → D3) is higher in Dex exposed than in control NSCs (P<0.05, chi-square test for proportions)

