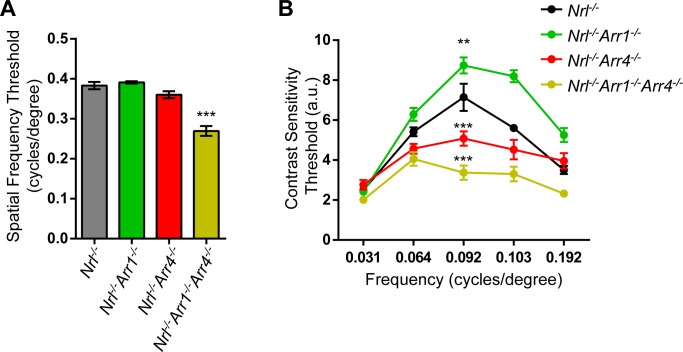
Figure 6.
Visual function testing of visual arrestin mutants using optokinetic tracking (OKT). (A) Spatial frequency thresholds, indicating visual acuity of the mice. Only Nrl−/−Arr1−/−Arr4−/− mice had a decreased spatial frequency threshold compared to Nrl−/− (***P < 0.001). (B) Contrast sensitivity of each mouse genotype, measured at frequencies from 0.031 to 0.192 c/d. At the peak of the contrast sensitivity (0.092 c/d), Nrl−/−Arr1−/− mice had a higher contrast sensitivity measurement than Nrl−/− mice (**P < 0.01), while Nrl−/−Arr4−/− (***P < 0.001) and Nrl−/−Arr1−/−Arr4−/− mice (***P < 0.001) had significantly decreased contrast sensitivity compared to Nrl−/− mice.

