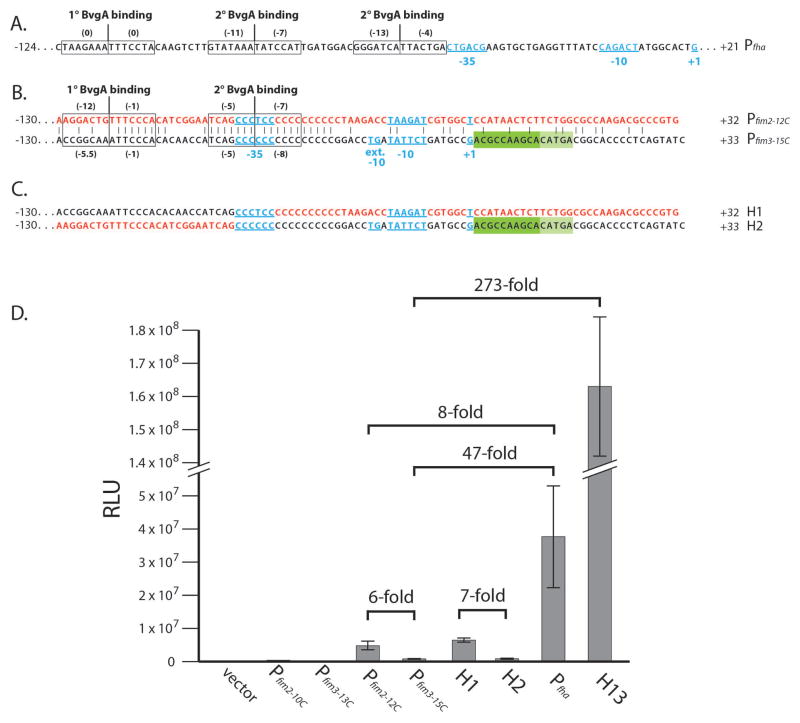
Fig. 1. Pfim3-15C transcriptional activity in B. pertussis.
(A). Sequence of Pfha. The −35 region, −10 element, and transcription start site +1 are in blue underlined. The numbers at each end indicate the extent of cloned fragments. The BvgA binding sites are boxed, with a vertical line to indicate the center, and with numbers in parentheses that denote scores of the individual half-sites using an algorithm to assess BvgA~P binding strength (Chen et al., 2010, Merkel et al., 2003).
(B). Sequence comparison of Pfim2-12C (in red) and Pfim3-15C (in black). Identical residues are denoted by vertical dashes. The −35 region, extended −10 −15TG−14 motif, −10 element, and transcription start site +1 are in blue underlined. Positions +1 to +15 constituting the DRE are indicated by a dark and light green rectangles to indicate its repressive effect observed in the deletion or swapping analysis. The numbers at each end and the BvgA binding sites are indicated as in (A)
(C). Cloned hybrid sequence for H1 and H2 with colors as in (B) to indicate sequence source.
(D). B. pertussis strain BP536 harboring chromosomally integrated pSS3967 containing no insert (control), or different promoter constructs were grown on BG agar and analyzed for light production by luciferase as described in the Experimental Procedures. Values are given in arbitrary units (RLU for relative light units). Data averaged from at least four assays were used in the calculation of standard deviations as indicated by error bars.

