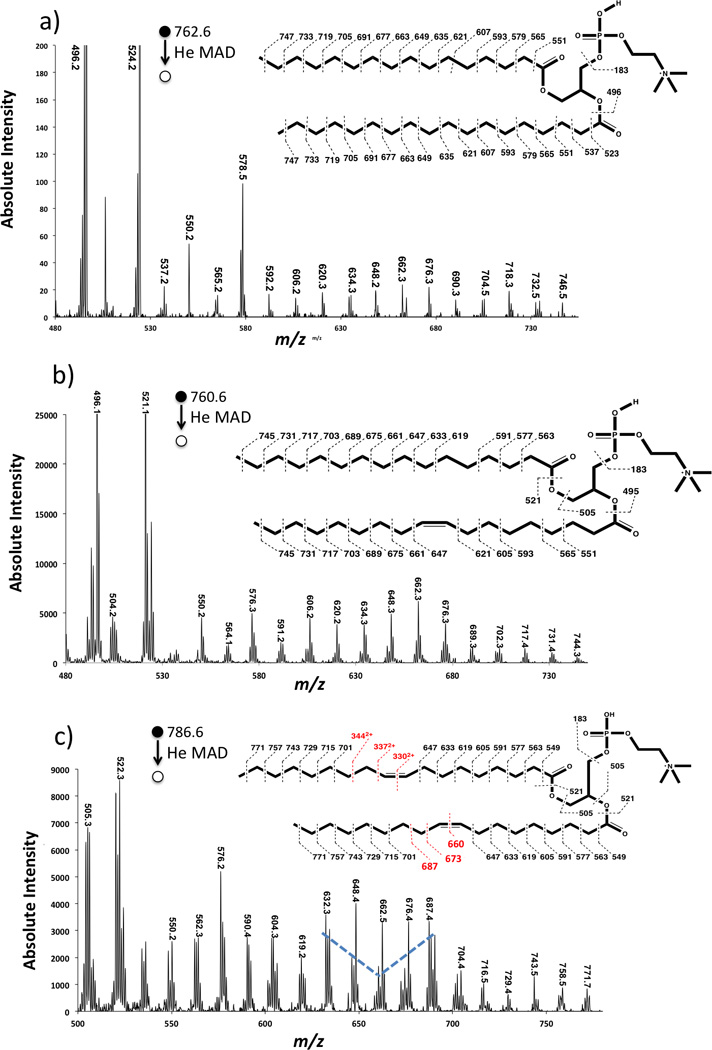
Figure 3.

He-MAD spectra of a) PSPC (16:0/18:0) and b) POPC (16:0/18:1) and c) 9Z-DOPC (18:1/18:1) showing the high energy or radical-induced cleavage of the acyl chains. Mass labels on the spectra show the most abundant masses in a cluster. Mass labels on the structures show expected fragments without H-transfers or rearrangements.
