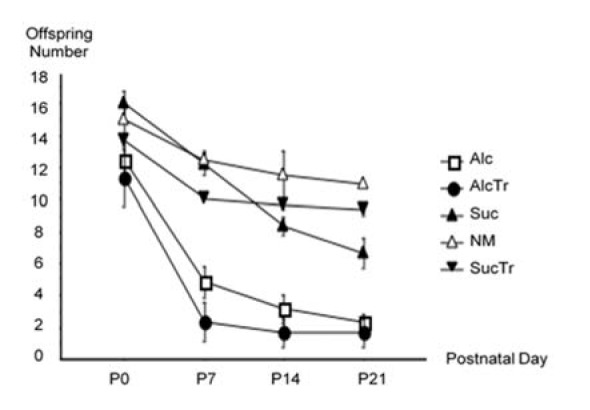
Figure 1. Offspring Survival Rates from Birth (P0) to Weaning (P21), comparison among NM, Suc, Alc, SucTr, and AlcTr groups (n = 3-6 mothers per study group).

Data demonstrated as mean ± SEM. ANOVA test revealed that survival rates of the groups examined were significantly different at p < 0.0001 when compared the groups: Alc and Suc, Alc and NM, AlcTr and Suc, AlcTr and NM, AlcTr and SucTr; and at p = 0.0001 when compared the groups of Alc and SucTr. NM = normal control group; Suc = Iso-caloric sucrose, pair-fed control group; Alc = maternal alcohol treated group; SucTr = Iso-caloric sucrose + maternal taurine supplementation, pair-fed control group; AlcTr = Maternal alcohol + maternal taurine supplementation group.
