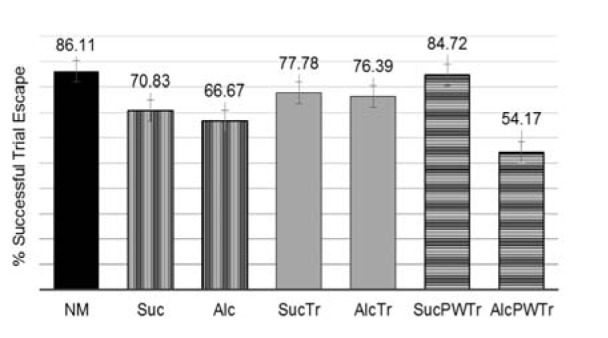
Figure 5. Mean Percentage of Overall Successful Trial Escape, comparison among NM, Suc, Alc, SucTr, AlcTr, SucPWTr and AlcPWTr, groups (n = 6-8).

Data demonstrated as mean ± SEM. When analyzed using ANOVA analysis per trials, there was a level of significant difference among trials at p = 0.0001. When analyzed the percentage of escapes among all groups investigated, it was found that they were significantly different at p = 0.0001. NM = normal control group; Suc = Iso-caloric sucrose, pair-fed control group; Alc = maternal alcohol treated group; SucTr = Iso-caloric sucrose + maternal taurine supplementation, pair-fed control group; AlcTr = Maternal alcohol + maternal taurine supplementation group; SucPWTr = Iso-caloric sucrose + post-wean offspring taurine supplementation, pair-fed control group; AlcPWTr = Maternal alcohol + post-wean offspring taurine supplementation group.
