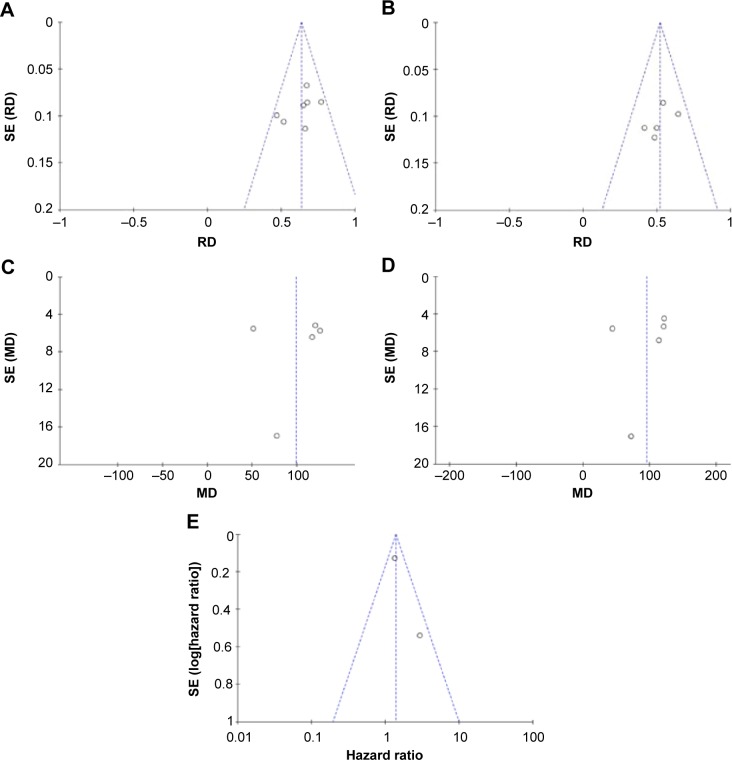
Figure 5.
Funnel plots for publication bias.
Notes: HMGB1 in tissue with ovarian cancer and normal ovary (A). HMGB1 in tissue with ovarian cancer and benign ovarian cancer (B). HMGB1 in serum with ovarian cancer and normal ovary (C). HMGB1 in serum with ovarian cancer and benign ovarian cancer (D). The association of HMGB1 expression level and the risk of ovarian cancer (E).
Abbreviations: MD, mean difference; RD, risk difference; SE, standard error.

