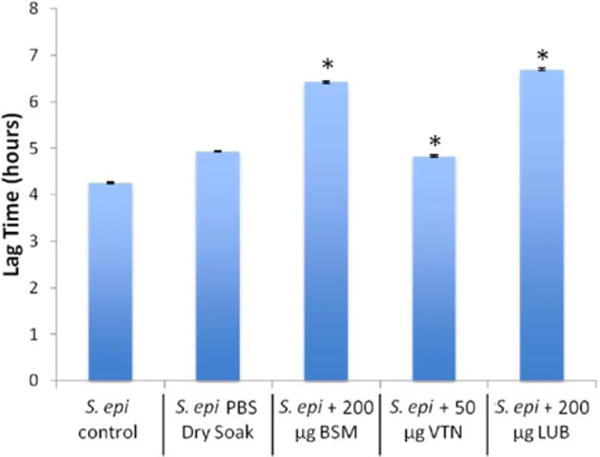
FIGURE 6.

Lag times for S. epidermidis with each protein derived from the mathematical model (data = ±95% confidence interval). *indicates significant difference from control and PBS dry soak (p < 0.05). [Color figure can be viewed in the online issue, which is available at wileyonlinelibrary.com.]
