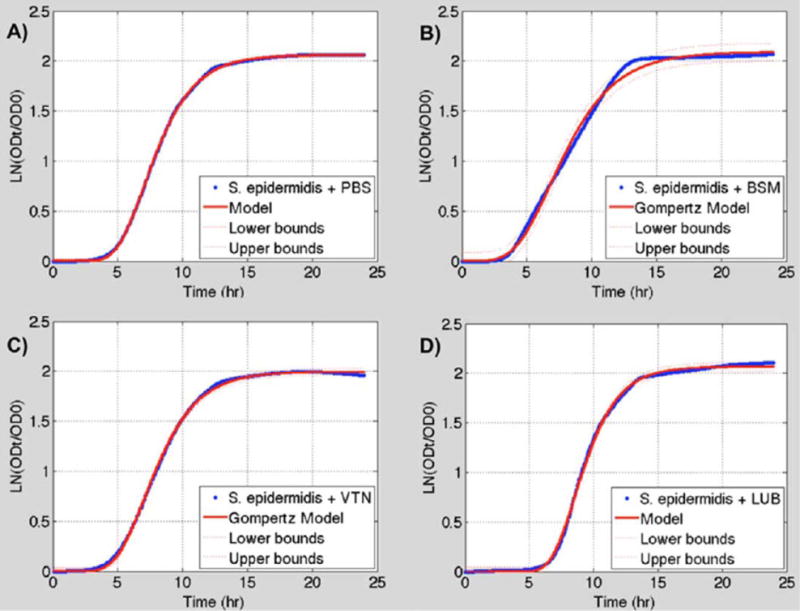
FIGURE 8.

(A) S. epidermidis + PBS growth data (blue) fitted to a modified Gompertz growth curve (red). (B) S. epidermidis + BSM growth data (blue) fitted to a modified Gompertz growth curve (red). (C) S. epidermidis + VTN growth data (blue) fitted to a modified Gompertz growth curve (red). (D) S. epidermidis + LUB growth data (blue) fitted to a modified Gompertz growth curve (red). 95% confidence interval for the models is shown by the dashed red lines. Logistic models are not shown. [Color figure can be viewed in the online issue, which is available at wileyonlinelibrary.com.]
