
Fig. 7. Cooperation of insulin and TGF-β signaling in epithelial plasticity and migration.
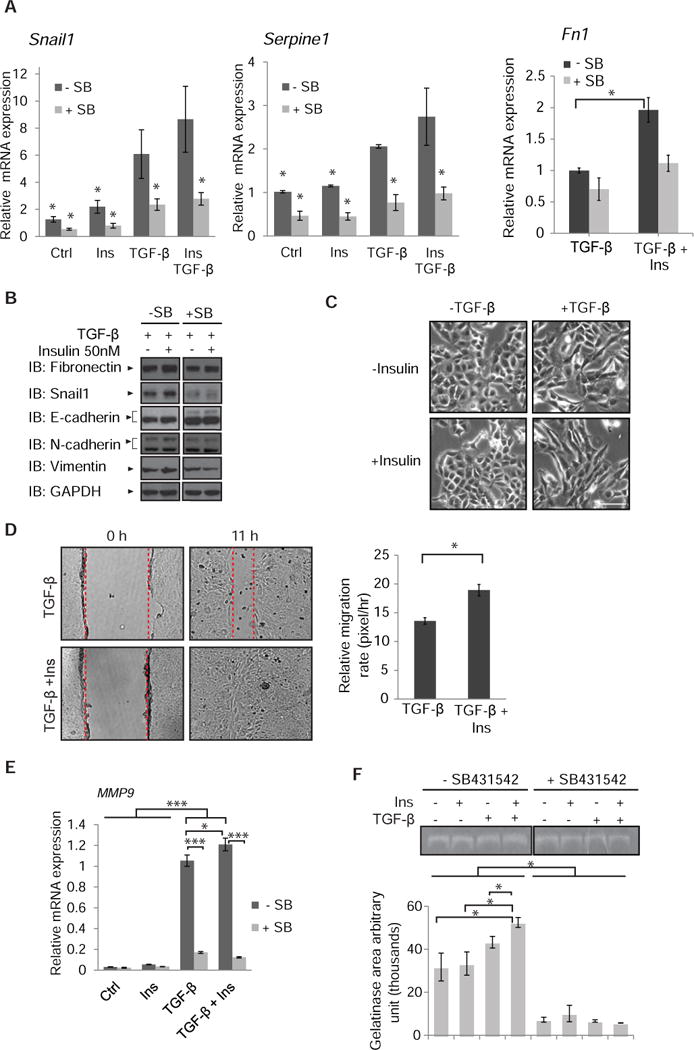
(A) TGF-β-induced Snai1, Serpine1 and Fn1 mRNA expression in NMuMG cells was enhanced after 90 min of insulin exposure. mRNA was quantified by qRT-PCR and normalized against RPL19 mRNA. Error bars indicate standard errors, based on three independent experiments with duplicates. * p < 0.05, compared with the TGF-β group by Wilcoxon test. (B) Immunoblot analysis of EMT-associated protein abundance of NMuMG cells treated with TGF-β or TGF-β and insulin for 24 h in the presence or absence of SB431542. GAPDH served as loading control. Immunoblots are representative of two independent experiments. (C) Phase contrast images of NMuMG cells treated with TGF-β, insulin, or both for 24 h. Images are representative of three independent experiments. Scale bar, 100 µm. (D) Migration of NMuMG cells, in the presence or absence of TGF-β with or without insulin, measured in a monolayer wounding assay. Confluent monolayers were scratched with a pipette tip at time 0 (left), and cells were allowed to migrate into the wounded area for 11 h (right). The migration distance was measured and is graphically presented. Error bars indicate standard error of the means of three experiments. Statistical significance was determined by Wilcoxon test; *p<0.05. (E) TGF-β-induced Mmp9 mRNA expression in NMuMG cells is enhanced in the presence of insulin. NMuMG cells were treated for 24 h with or without insulin in the presence or absence of TGF- β. Error bars indicate standard errors, based on three independent experiments. (F) Gelatinase zymogram of equal amount of protein extracted from the media of cells treated with insulin, TGF-β, or insulin and TGF-β, in the presence or absence of SB431542. Densitometric analyses represent MMP9 activities. Error bars indicate standard errors, based on three independent experiments. Statistical analysis was carried out using non parametric Wilcoxon test; *p<0.05, ***p<0.001.