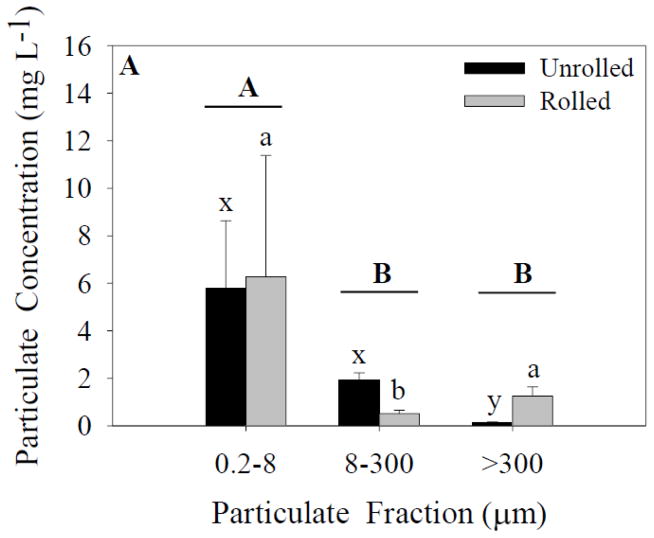
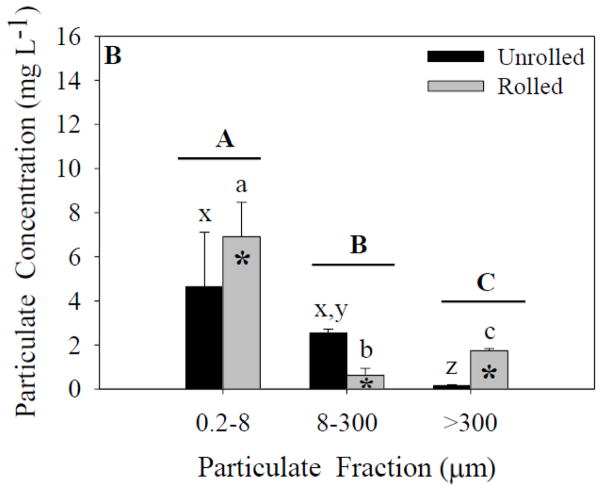
Figure 1.
Particulate concentrations for each size fraction and treatment. Capital letters specify significant differences between particle-size fractions (ANOVA model), whereas lower-case letters specify significant differences between particle-size fractions within a treatment (Tukey’s post-hoc test; x-z for unrolled treatment, a-c for rolled treatment). In experiment 1 (A), a significant effect of particle-size fraction was found (p<0.05). In experiment 2 (B) significant effects of both particle-size fraction and treatment were found (p<0.05). Data represent means ± standard deviation (n=6).


